Big Picture
- How to evaluate the firm value
- How to maximize the firm value to shareholders:
- Decision about finance
- Decision about investment
- Decision about operation
- Corporate governance: To alleviate the conflicts between managers and shareholders
Free Cash Flows
- Why we care cash flows? Free Cash Flows
- How to identify cash flows?
Discount Cash Flows
- Why to discount CF?
- What are the determinants of discount rate?
Total Valuation
- Are we creating value?
- How to mitigate forecast risk?
Intro
Profitable(accounting) vs. Value(NPV,Finance)
- Different Purpose
- Accounting is looking back to history
- Not considering risk, which happened already
- Finance is looking forward to future
- Have to consider risk
- Accounting is looking back to history
- Costs in Finance
- In finance, investment costs include not only costs paid in cash, but also the non-cash, such as opportunity cost.
- Opportunity cost is the value of the best alternative forgone
- In finance, investment costs include not only costs paid in cash, but also the non-cash, such as opportunity cost.
- When the investment income is greater than all of the above costs, we say the investment “creates value
Introduction of Corporate Finance
金融是价值的跨期交换。
what is corporation
- Common forms of Business Organizations
- Sole Proprietorship (个体工商户)
- 无限责任
- 收取所有利润
- 个人与公司资产没有法律上的分别
- Partnership(合伙企业)
- General partnership
- 无限责任
- Limited partnership
- 不参与business
- 有限责任
- LP付给GP管理费management fee,GP运营,最后付给LP本金后可以收取20%利润
- General partnership
- Corporation(公司制)
- ownership和control分开
- shareholders and board of directors
- 自己是一个法律entity
- ownership和control分开
- Sole Proprietorship (个体工商户)
| sole proprietorship | partnership | company | |
|---|---|---|---|
| Advantages | easiest to start | run by GP | Limited liability |
| least regulated | More capital available | separation of ownership and management | |
| exclusive control and keep all profits | relatively easy to start | transfer of ownership is easy | |
| income tax once as personal income | income tax once as personal income | unlimited life | |
| easier to raise capital | |||
| Disadvantages | limited to life of owner | Dilution of control power | separation of ownership and management |
| equity capital limit to owner’s wealth | unlimited liability | double taxation | |
| Unlimited liability | partnership dissolves when on GP dies or sell out | costly to start | |
| Difficult to attract skilled employee | difficult to transfer ownership | ||
| Difficult to sell ownership interest |
Goal of financial management
To maximize the market value of existing owner’s equity.
Agency Problems
agency relationship
Debtors and Shareholders is an agency relationship, shareholders represent debtors.
stockholders and management is an agency relationship, management represent stockholders.
ways to solve
- management compensation
- stock options
- promotion
- enhance control over the firm
- internal control, replace bad managers
- external control, hostile takeover threat
- bankruptcy threat
3 basic financial management decisions
investment decision (capital budget)
- trade-off between short-run and mid-run productivity.
- current asset vs. fixed asset
financing decision (issuance of securities)
- trade-off between tax-shield and low cost of financial distress
- leverage ratio
Operating decision (curr. asset vs. curr. liability)
- net working capital = cur. asset - cur. liability
- NWC is usually positive in healthy firm
- liquid higher, less chance to be in financial distress
- a trade-off between liquidity and long-term potential return
- a trade-off between liquidity and profit
Finance markets
- Primary markets
- The original sale of securities by corporations
- Cash flows into the firm from investors
- firms -> underwriting syndicate(承销商, banking groups -> investment banker) -> individual and/or institutional investors
- Secondary markets
- Once issued, stocks and bonds are bought and sold between investors in secondary markets
- Exchange market, OTC
financial statements, taxes, and cash flow
Mkt vs Book value
- The balance sheet provides the book value (historical cost) of the assets, liabilities, and equity
- The market value is the price at which the assets, liabilities or equity can actually be bought or sold today
- 对于健康的成长公司,mkt value > book value
- market value更重要,反映当前的cash flows
- 主要的变化在于equity,即股价波动
cash flow and accounting income
- To companies, cash flow is more important than profit
- Negative profit doesn’t lead to bankruptcy, as long as there is cash flow
- Bankruptcy does not mean negative profit. It is simply due to no cash to pay interest
mismatch
- GAAP (权责发生制)
- Depreciation
- Receivable Financial Cash Flow
- Payable
- Deffered
Financial cash flow
- To evaluate a project or a firm, we must determine its Cash Flow From Assets (CFFA)
- CFFA tells us the cash flow (positive or negative) generaged by the corporation as a legal entity during a period
Cash flow from assets (CFFA)
- Operating cash flow (OCF)
- earnings before interest and taxes plus depreciation minus taxes
- the cash flow that results from the firm’s day-to-day activities of producing and selling
- = EBIT –Tax+ Depreciation (I/S)
- = NI + Depreciation + interest
- Making money
- See #IncomeStatement
- “Making Money”
- Additions to net working capital ($\Delta$ NWC)
- change in (current assets - current liabilities)
- = Ending NWC - Beginning NWC
- “Leave money for operation”
- Net Capital spending
- (Acquisitions of fixed assets minus sales of fixed assets)
- money spent on fixed assets less money received from the sale of fixed assets
- = Ending net fixed assets (B/S)- Beginning net fixed assets (B/S)+ Depreciation (I/S)
- “Leave some money for fixed assets”
- $\color{red}{CFFA = OCF - \Delta NWC - NCS}$
cash多对debtor好,对shareholder坏。
reduce CFFA -> reduce value of the firm
CF(A) = CF(D) + CF(E), right hand side = cash flow to investors in firm
asset = debt + equity
Cash flow goes to equity holders
- Dividends plus repurchase of equity minus new equity financing
Cash flow goes to debtor
- interest plus retirement of debt minus long-term debt finacing
主要看OCF是不是正的,健康的business经常是正的OCF
- exception:startup company
CFFA的正负不太重要
Long-term Financial Planning and Growth
- Payout ratio = Dividends / Net Income
Financial Planning Process
Case 1: Assuming growth is driven by sales
- Step 1:Forecast sales growth rate g (g is completely exogenous)
- Step 2: In the case when sales drive assets, everything will grow at the same rate as sales, which leads to a constant profit margin
- Step 3: Prepare forecast financial statements (pro forma statements), which show
- Requirement of fixed assets and net working capital
- Financing arrangements (i.e., dividend policy, debt policy)
- Step 4: Vary assumptions
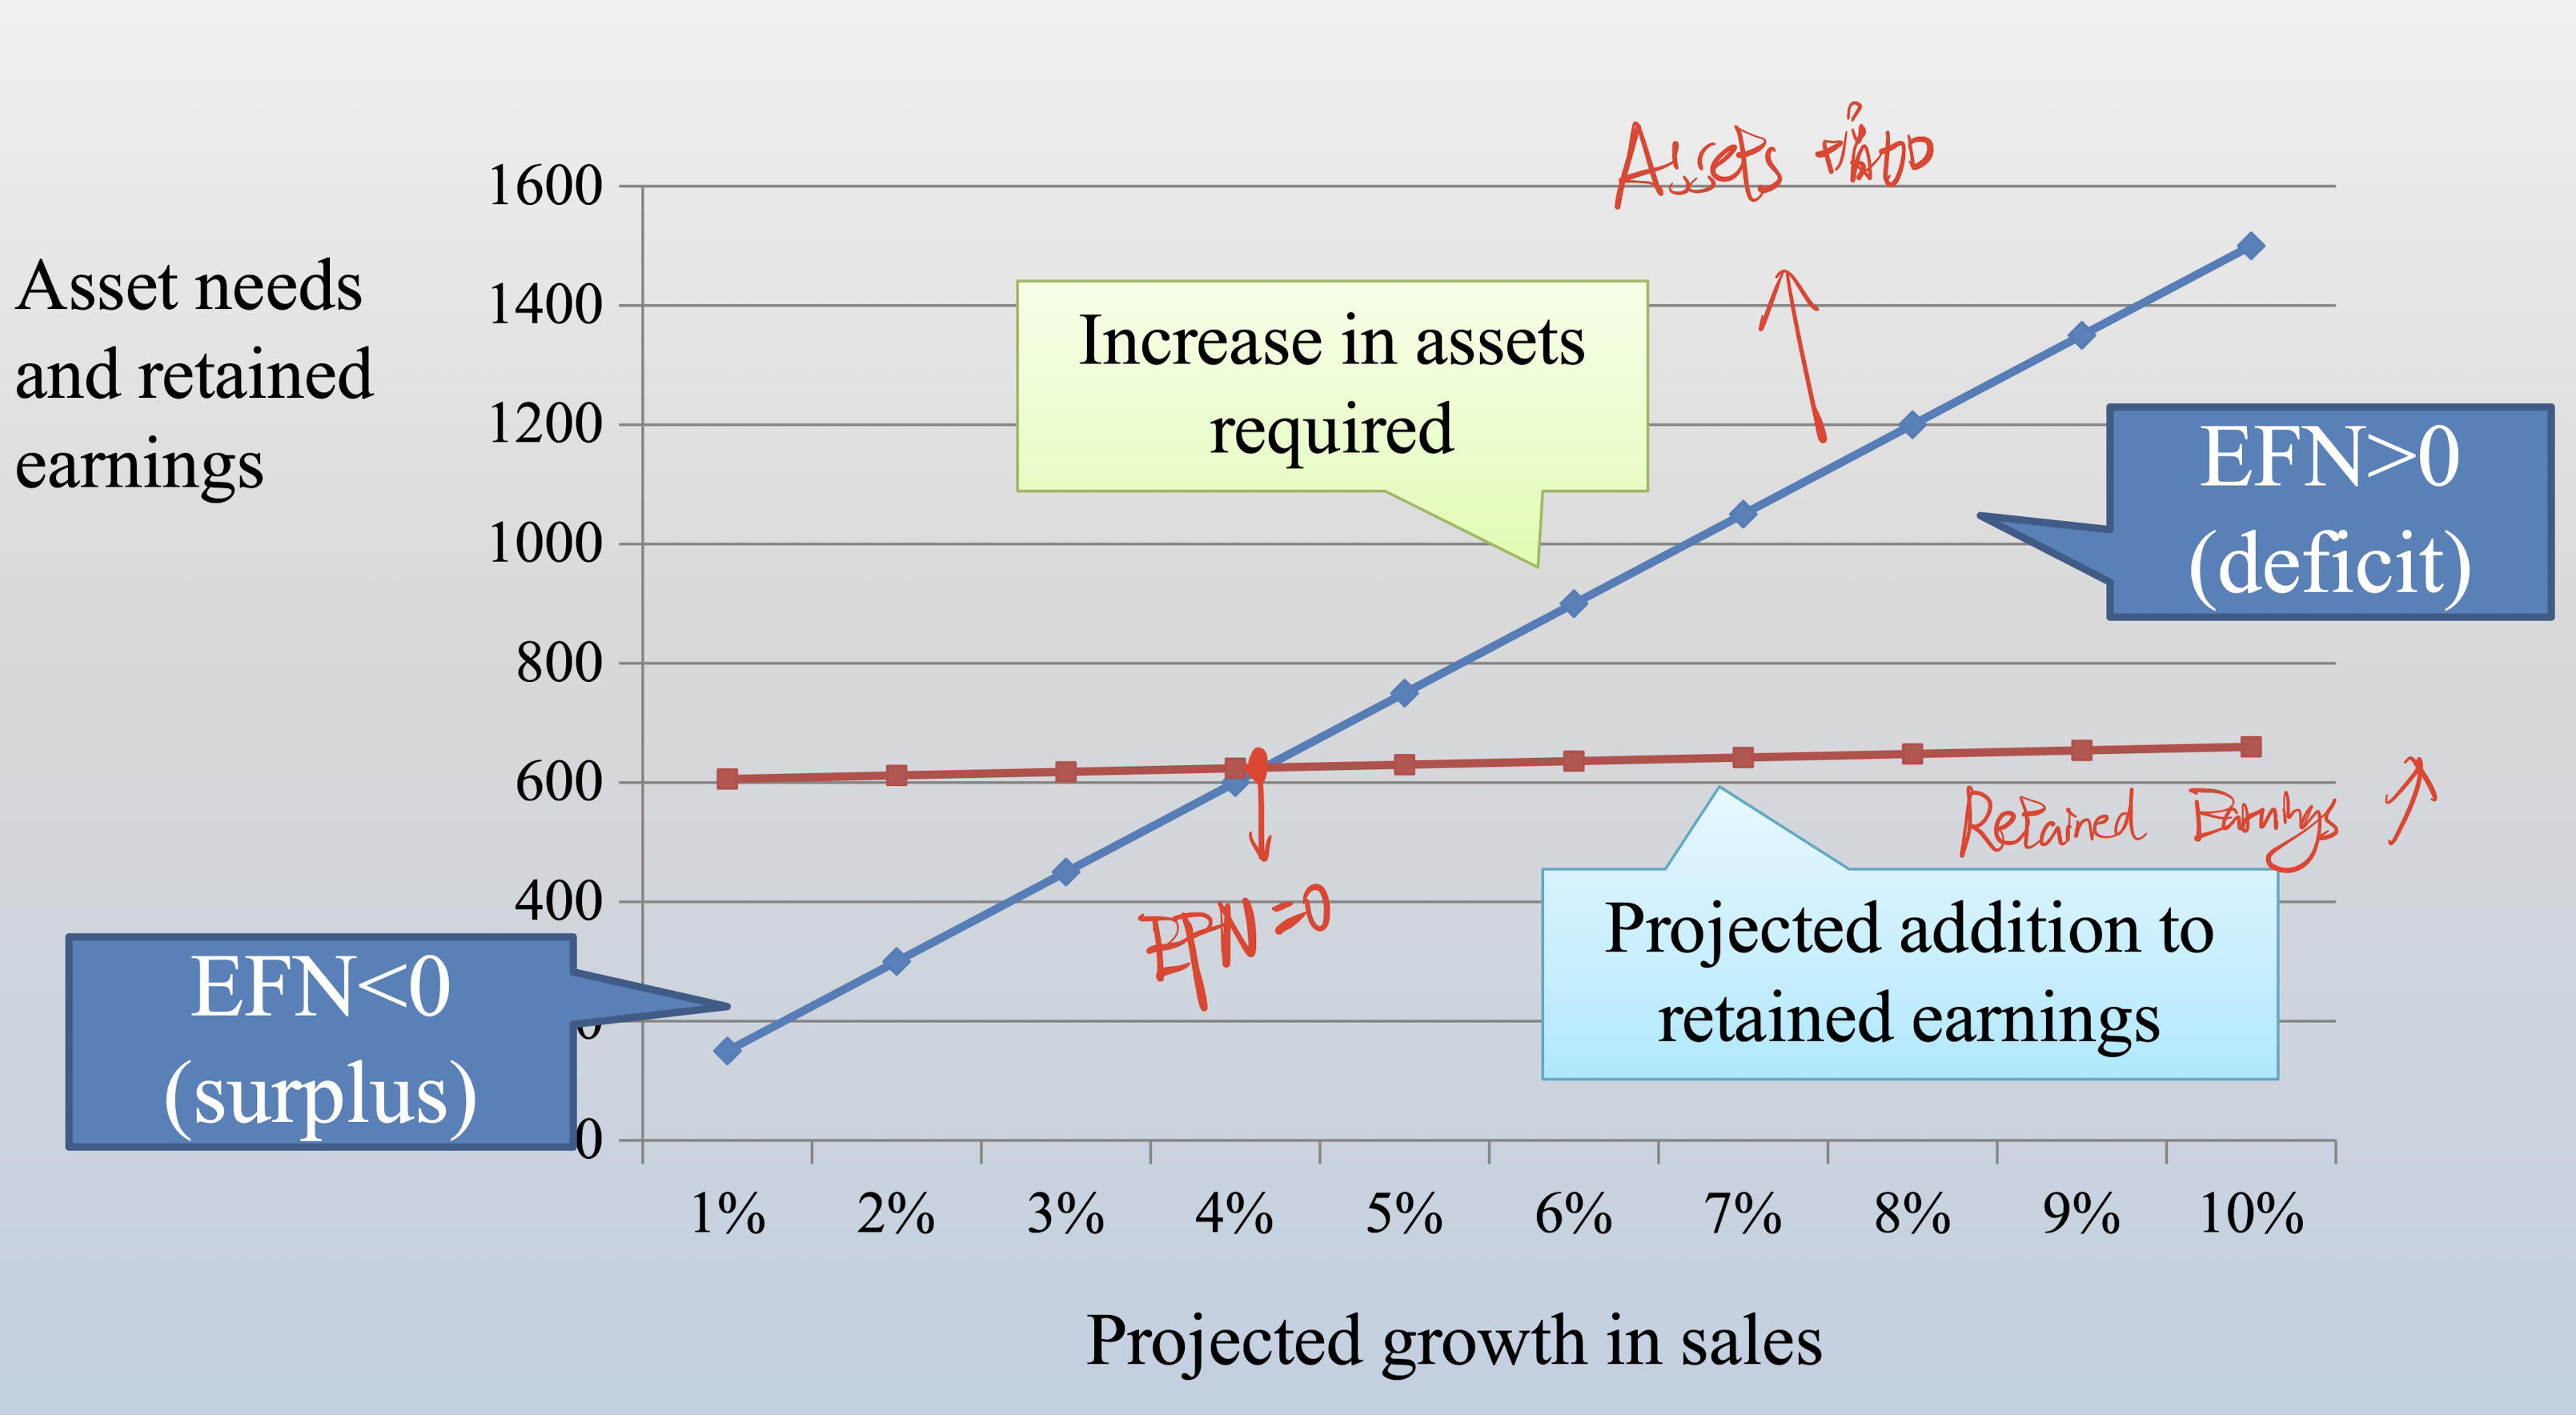
- EFN: external finance needs
Case 2: Internal growth rate
- Assuming growth is not driven by sales, instead it is driven by internal retained earnings only, meaning No external financing!
- Asset is growing at g with only internal retained earnings
- What is the maximum growth rate that can be achieved?
- $$NI_t=(1+g) \times NI_{t-1} $$
- $$RE_t=NI_t \times b \quad \text {,b is Retention Ratio } $$
- $$EFN=0 \Rightarrow \Delta A_t=A_{t-1} \times g=RE_t$$
- $$\text { From (1), (2) and (3),} \quad A_{t-1} \times g=(1+g) \times NI_{t-1} \times b $$
- $$\text { Define ROA }=NI_{t-1} / A_{t-1}, \quad \rightarrow \text { 资产回报率 } $$
- $$\begin{array}{l}\text { Internal growth rate } \qquad g=\frac{R O A \times b}{1-R O A \times b}=\frac{1}{1-R O A \times b}-1\end{array} $$
Case 3: Sustainable growth rate
- Assuming growth is not driven by sales and is not driven by RE either
- Instead, a firm chooses debt financing to maintain a constant debt-equity ratio
- In such a case, equity and debt are growing at g to maintain the constant debt-equity ratio
- $$\frac{E_{t-1}}{A_{t-1}}=\frac{E_t}{A_t}=\frac{E_{t-1}+R E_t}{A_{t-1} \times(1+g)} \quad (1)$$
- $$R E_t=N I_{t-1} \times(1+g) \times b \quad (2)$$
- Dividing both sides of equation (1) by $E_{t-1} / A_{t-1}$ , we get
- $$1=\frac{1+\frac{R E_t}{E_{t-1}}}{1+g}=\frac{1+\frac{N I_{t-1} \times(1+g) \times b}{E_{t-1}}}{1+g}$$
- Define ROE $=NI_{t-1} / E_{t-1}$ , (可维持增长率), we have
- $$1+g=1+R O E \times(1+g) \times b=> $$
- $$ g=\frac{R O E \times b}{1-R O E \times b}=\frac{1}{1-R O E \times b}-1$$
可持续增长率 $\ge$ 内部增长率
- ROE允许borrow
怎样提高可持续增长率?
- 提高b
- 提高ROE/ROA
- Increase operating efficiency (Increase profit margin or decrease operating cost)
- Increase target debt-equity ratio
Time Value of Money
It is only possible to compare values at the same point in time!
Interest rate (Discount rate)
- If we assume cash flows are risk-free, then we use risk-free interest rate, such as bank deposit rate.
- When cash flows are risky, we should use interest rates with risk premium
- Later, discuss the determinants of risk premium.
Future value (FV) and Present Value (PV)
- The future value is the amount of money an investment will grow to over some period of time at some given interest rate.
- For one period: FV=PV(1+r) where
- FV = Future value
- PV = Present value
- r = (market) interest rate for one period
- Note: One period could be one day, one month, one year, etc.
- The present value is the current value of future cash flows discounted at the appropriate discount rate.
- FV = PV × (1 + r)
- thus PV = FV /(1 + r)
Present Value and Discounting
- For two or more periods:
- PV = FV / (1 + r)t
- r is often called the discount rate.
- 1/(1+r)t is the present value interest factor (PVIF) or called the discount factor.
- the “value” of something
- Generally referred to the present value unless specifically indicate that we want the future value
Some useful terminology
- “in period x” means at the end of the xth period
- for example:
- “in year 5” means the end of the fifth year
- “how much will you have in year 2” means how much will you have at the end of the second year
- Unless otherwise stated, the rate of return and discount rate given in problems is assumed to be an annual rate
- In practice, interest rates are typically stated on a per annum basis
- Adjustments must be made for fractional year
Discounted Cash Flow Valuation
Relatively easy, so just put part of the content in this note
- Annuity – a finite series of equal payments that occur at regular intervals
- If the first payment occurs at the end of the period, it is called an ordinary annuity (普通年⾦)
- If the first payment occurs at the beginning of the period, it is is called an annuity due (期初年⾦)
- Unless stated otherwise, all annuities are assumed to be ordinary annuities
- Perpetuity (永续年⾦) – an infinite series of equal payments
- PV = C/r
- If the payment grow at g each period, then
- PV = C /(r-g)
- $\begin{aligned} & \text { PV of annuity }=C \times\left[\frac{1}{r}-\frac{1}{r(1+r)^T}\right]=\frac{C\left[1-\frac{1}{(1+r)^T}\right]}{r} \ & F V \text { of annuity }=C\left[\frac{(1+r)^T-1}{r}\right]\end{aligned}$
APR and EAR
- APR:
- annual interest rate is always quoted assuming no compounding within one year
- EAR:
- Effective Annual Rate (EAR) is the actual rate paid (or received) after accounting for compounding that occurs during a year.
$$\mathrm{EAR}=\left[1+\frac{\mathrm{APR}}{\mathrm{m}}\right]^m-1$$
- $\mathrm{m}$ is number of compounding per year or compounding frequency.
- $\mathrm{EAR}=\mathrm{APR}$ when $\mathrm{m}=1$, annually compounding
- What occurs as the frequency of compounding rises to infinity?
$$
E A R=\operatorname{lim}_{m \rightarrow \infty}\left(\left(1+\frac{k}{m}\right)^m\right)-1=e^k-1
$$ - Example:
- The effective annual rate that’s equivalent to an annual percentage rate of $18 %$ $$=\mathrm{e}^{0.18}-1=19.72 %$$
- (almost the same value with daily compounding)
Basic types of Loans
- Pure discount loans
- No periodic interest payment
- sold at discount
- Interest-only loans
- periodic payments are interest only
- Amortized loans
- periodic payments include both interest and some principal
- Discount interest loans
- 提前支付interest
Interest Rate and Bond Valuation
Bond
Definition of a bond
- issuer borrows dollar and makes specified payments to bondholder on set dates
Characteristics
- Face value, princeple, or par value
- Coupon rate (different from market Interest rate): Zero coupon bond
- Maturity
- Bond Indenture (债券契约)
Corporation bonds
- regular
- callable(可赎回),
- puttable(可卖回),
- convertible(可转换)
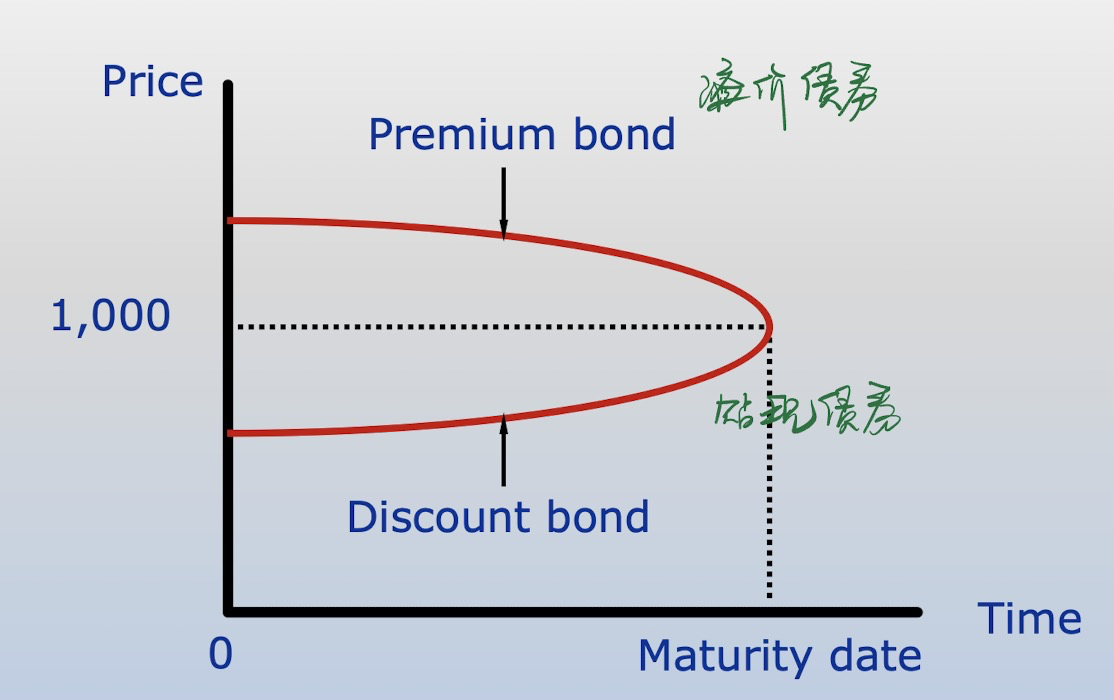
Price and interest rates have a reverse relationship
Bonds selling at discount
- Price < face value
- Coupon rate < market rate
Bonds selling at premium
- Price > face value
- Coupon rate > market rate
Invoice price = flat price + accrued interest
dirty price = clean price + accrued interest
Yield to Maturity
assumptions about YTM
- hold the bond to maturity.
- re-invest the coupon on the same bond.
- Assuming market interest level maintains unchanged.
Can’t compare two investment decision by comparing YTM, because high risk high return.
- only ok when have exactly same characteristics
Holding period yield and holding period return.
Term structure
The yield curve displays the relationship between spot rates and maturities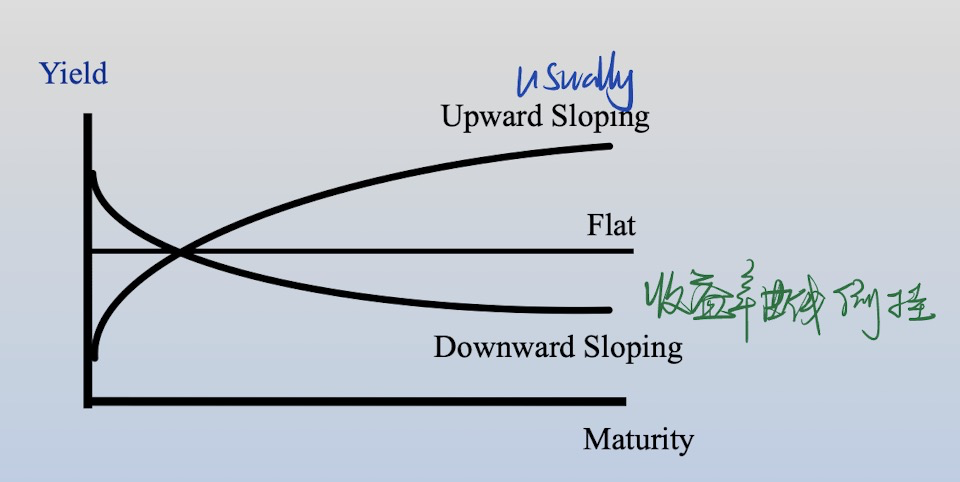
- Different shapes of the term structure
- Upward Sloping
- Long-term spot rates > Short– term spot rates
- Downward Sloping
- Long-term spot rates < Short–term spot rates
- Flat
- Long-term spot rates = Short-term spot rates
- Humped
- Intermediate term spot rates > Short and Long-term spot rates
- Upward Sloping
- The Yield Curve is Time Varying
- Measuring the Term Structure (Yield Curve)
- Method I: Computing from zero-coupon bond
- Bondprice $=\frac{\text { Par }}{\left(1+r_n\right)^n}$
- Method II: When zero-coupon bond is not available, the bootstrapping method!
- Use bonds of progressively longer maturities, starting from T-bills
Determinants of Bond Yield
- Level of Market interest rate
- Default risk
- quality of the issuer, security, and seniority
- risk structure
- Describes the relationship between YTM and credit risk level
- Credit risk: the risk that the issuer of a bond may default(i.e., will be unable to make timely principal and/or interest payments)
- Bond ratings
- measures the prob. of default
- Internationally recognized rating companies:
- Moody’s
- Standard Poor’s
- Fitch Ratings
- BBB-及以上属于investment,以下属于speculatino(投机)
- Default risk and security
- Collateral is a general term that frequently means securities(i.e., bonds and stocks) that are pledged as security for payment of debt.
- Mortgage securities are secured by a mortgage on the real property (i.e., land or buildings) of the borrower.
- Secured vs. Unsecured
- 破产时优先还secured的人的钱
- Interest rate
- Only one risk from market: interest risk
- The risk that arises for bond owners from fluctuating (market) interest rate is called interest rate risk.
- How much interest rate risk a bond has depends on how sensitive its price is to interest rate changes.
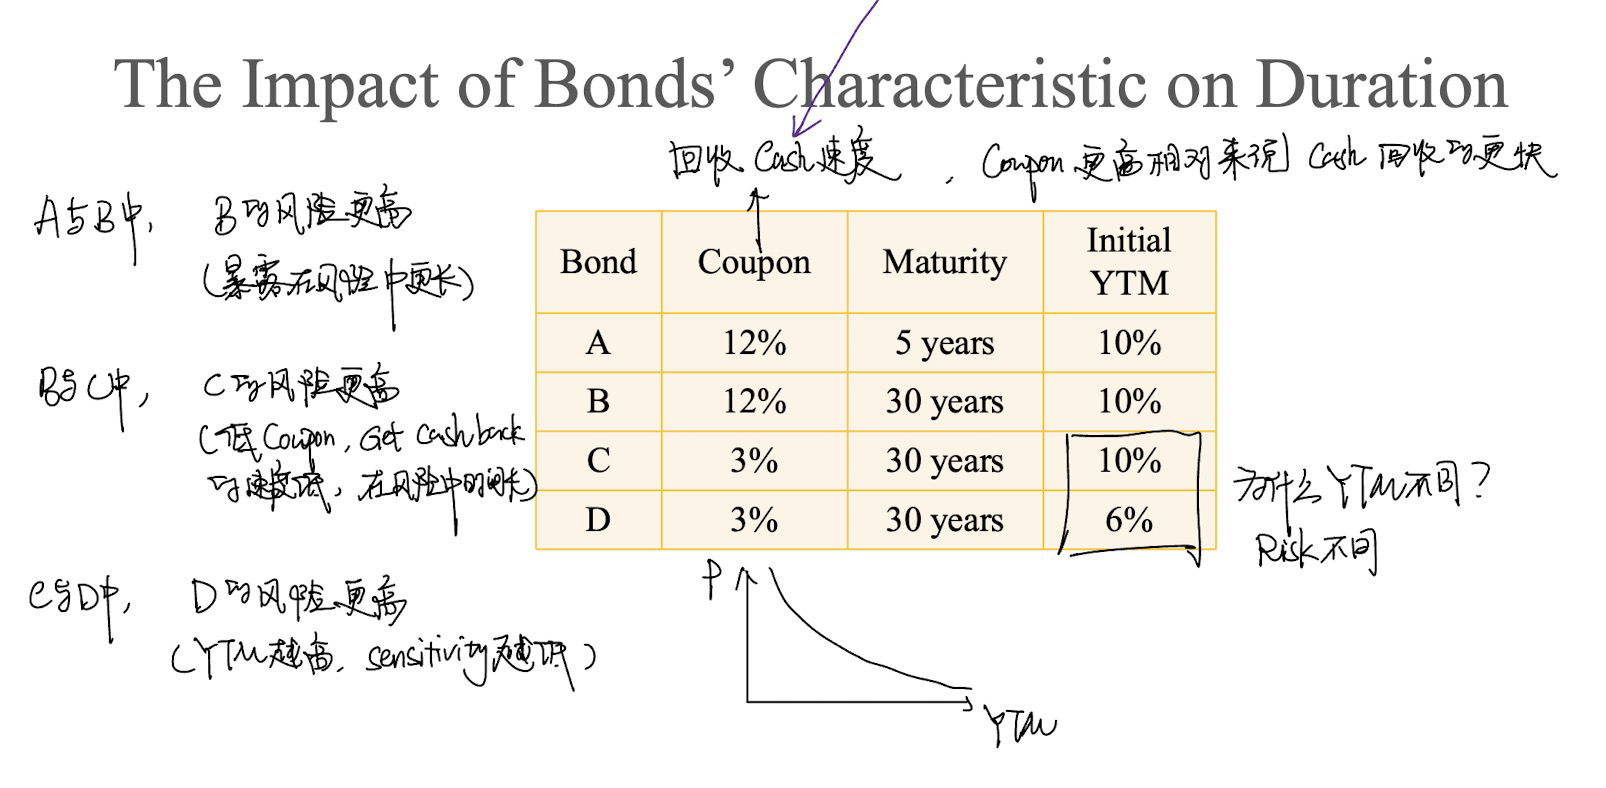
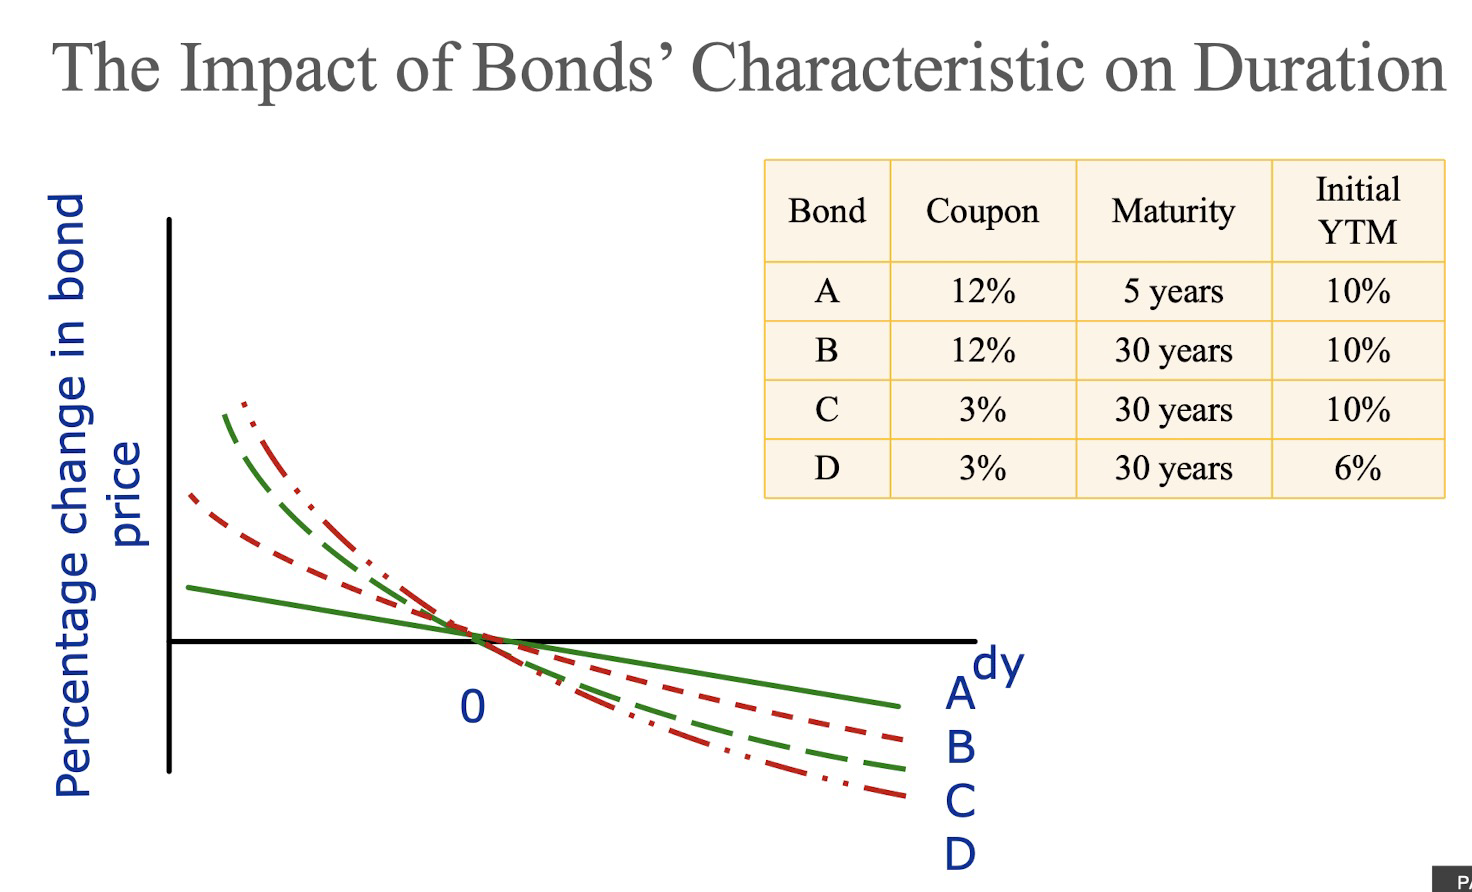
- Duration
- $\color{red}{讲的不太清楚,投资学再看一下}$
- 期限的加权平均(mac duration)
- 平均多长时间把cash收回来
- Duration is equal to maturity for zero coupon bonds
- Duration is shorter than maturity for coupon bonds
- Holding other factors constant, duration is lower when the yield to maturity is higher
- Holding other factors constant, duration is lower when the coupon rate is higher
- Real rate, Nominal Rates, and Inflation
- The nominal interest rate is the percentage change in the number of dollars
- Financial rates, such as interest rates offered by banks and other financial institutions, and the rates for discounting cash flows, are almost always quoted in nominal terms.
- The real interest rate is the percentage change in terms of purchasing power.
- The inflation rate is then defined based on the growth rate of consumer price index (CPI)
- the Fisher Effect
- $(1+R) = (1+r) \times(1+h)$
- R 名义利率,r实际利率,h通货膨胀率
- $R \approx r + h$
- The nominal interest rate is the percentage change in the number of dollars
- Taxability
- Embedded Options
- Callable bond (可赎回债券),卖的价格低
- Grants the issuer the right (but not the obligation) to retire the bond before the scheduled maturity date.
- The call price will usually exceed the face value.
- Putable bond (可售回债券),卖的价格高
- Grants the bondholder the right )but not the obligation) to sell the bond back to the issuers on designated dates.
- Convertible bond (可转换债券),卖的价格高
- Gives the bondholder the right (but not the obligation) to exchange the bond into a specified number of shares of common stock during a certain period.
- Callable bond (可赎回债券),卖的价格低
- Liquidity Risk (Lack of Marketability)
- Investors demand a liquidity premium on illiquid bonds.额外流动性费用
- The upward sloping yield curve is an illustration of investors’ preference for liqudity
- 流动性好的市场,asset价格更高
Stock Valuation
A share of common stock is more difficult to value in practice than a bond
- There are no promised cash flows.
- Cash flows are unknown in advance.
- The life of the investment is infinite.
- Common stock has no maturity
- The rate of return that investors requires is unobservable.
- There are no promised cash flows.
What can we do?
- Discounted CF
- FCFF(free cash flows of the firm)
- PV(equity)= PV(firm)-MV(debt)
- MV: market value
- pros
- applicable to all companies, divisions
- cons
- Complicated, costly and time consuming
- Difficult to estimate CFs for the distant future.
- Also hard to estimate the appropriate discount rate(WACC).
- FCFF(free cash flows of the firm)
- Dividend growth model
- Stock price = PV(Dividends) + PV(Expected Price)
- $P_0=(D_1+P_1)/(1+r)$
- r is the required rate of return for stocks (cost of equity)
- continue, $P_0=\sum_{t=1}^{\infty} \frac{D_t}{(1+r)^t}$
- stock price does not depend on how long an investor keep the stock
- 假设了公司不破产
- Some models
- Constant dividend, $P_0=\frac{D}{r}$
- Constant growth dividend, $P_0=\frac{D_1}{r-g}=\frac{D_0(1+g)}{r-g}$
- this is dividend growth model
- r > g
- Nonconstant growth
- Where does g come from?
- assume a constant ROE.
- Net Income = Return on Equity * Equity
- Growth of dividend = Growth of net income = Growth of equity
- g = ROE * b, b is retained ratio
- $E_1$ = earnings per share to be paid for the current year = Net income/Number of shares
- $D_1$ = Dividend per share=$E_1*(1-b)$
- assume a constant ROE.
- ROE决定了公司价值
- 当ROE>r时,随着b上升,$P_0$上升,是一家好公司
- 当ROE=r时,随着b上升,$P_0$不变
- 当ROE<r时,随着b上升,$P_0$下降,是一家不好的公司
- 股东想把钱拿回来去找别的项目获取更高的return
- “Quick and dirty” valuation – Multiples
- Price-Earning Ratio 市盈率
- price per share / earnings per share
- trailing P/E: $P_0/EPS_0$ (EPS over last 12 months)
- Forward P/E: $P_0/EPS_1$ (EPS over coming 12 months)
- 通常倾向于Forward P/E
- Value = Earnings * PE
- Price-Sales ratio
- Prick-Book ratio
- Price-Earning Ratio 市盈率
- Discounted CF
cost of equity: $R_E$
- Approach 1: CAPM
- Advan:
- explicitly adjust for systematic risk
- applicable to all companies
- Limit:
- estimate risk premium
- estimate beta
- need to rely on historical data
- Advan:
- Approach 2: Dividend Growth Model
- Advan
- easy to use
- Disad
- 必须当前在pay dividend
- 对于dividend增速不合理的无效
- 对预期增长率极度敏感
- 假定当前价格合理
- 没有显式考虑risk
- Advan
NPV and other investment criteria
NPV
NPV = PV(cash inflow) - PV(cash outflow)
If NPV positive, accept the project
choose the one with highest NPV
Advantages of NPV
- Account for the time value of money Account for the risk of the cash flows
- For different risk levels, your required return(or the discount rate) is different.
- Provide an indication about the increase in value
- NPV can be used for ranking purpose
- Account for the time value of money Account for the risk of the cash flows
Disadvantages of NPV
Require estimation of reliable future cash flows and appropriate discount rate
- It is very difficult to estimate cash flows for the distant future.
- It is also hard to estimate the appropriate discount rate.
Very complex, costly and time consuming
时间不相同不能直接比较!
- EAC(equivalent annual cost)
- present value of costs $=\sum_{t=1}^T \frac{E A C}{(1+r)^t}=E A C \times \sum_{t=1}^T \frac{1}{(1+r)^t}$
- 比较EAC,选择支出小的那个
IRR
It measures the effective return on the investment.
the discount rate that sets NPV to zero.
Minimum Acceptance Criteria (for independent projects)
- Accept if the IRR exceeds the required return (or the return on other alternatives in the market with equivalent risk and maturity),内部收益率超过了要求回报率
- This required return is the proper discount rate (r) of the projects.
- Another name for this required return is “hurdle rate”
For an independent project, IRR结果与NPV相同
- independent project:这个选择与其他选择无关
Mutually Exclusive Projects: only ONE of several potential projects can be chosen
- Acceptance of any one project implies the rejection of another
- Decision rule: rank all alternatives and select the best one.
Independent Projects: accepting or rejecting one project does not affect the decision of the other projects.
- Decision rule: accept it only if it exceeds a MINIMUM acceptance criteria.
Advantage of IRR:
- A single rate of return that summarizes the merits of a project – intuitively appealing
- If the IRR is high enough, you may not need to estimate a required return, which is often a difficult task.
- Since IRR is closely related to NPV, it will lead to identical decisions most of the time.
Disad:
- Sometimes there could be more than one IRR
- A single rate of return does not consider
- risk level of the project
- Life horizon of the project
- Direction of cash flow
- Cannot be used for comparison across projects!
- Therefore, IRR is not used for mutually exclusive projects usually
Generally, NPV is more reliable than IRR.
Payback Period and Discounted Payback Period
Payback period
- The number of years to recover all initial costs in a nominal sense?——不考虑钱的time value
- Decision Rule – Accept if the payback period is less than some preset limit
- The shorter, the better.
- Problems
- 没有考虑time value of money
- 没有考虑risk
- Doesn’t guarantee a single answer
- Ignores cash flow beyond the cutoff date.
- 随意的选择cutoff date
- Advan
- simple to understand
- biased towards liquidity
Discounted Payback period
- The length of time until the sum of the discounted cash flows is equal to the initial investment.
AAR: average accounting return
会计收益率法
- AAR = Average Net Income / Average Book Value of Investment
- need a target cutoff date
- Decision rule
- accept the project if AAR id great than a preset rate
- the higher, the better.
- Disadvantages of AAR
- Affected by accounting practices.
- AAR changes if the way of asset depreciation changes.
- Ignores the time value of money & the risk of the cash flows
- Requires an arbitrary cutoff point
- Based on accounting net income and book values, not cash flows and market values
- It is not a true rate of return.
- Affected by accounting practices.
- Advantages of AAR
- Easy to calculate
- Accounting information will almost always be available
PI (profitability index)
- Profitability index is the present value of an investment’s future cash flows divided by its initial cost.
- $\begin{aligned} \mathrm{PI} & \equiv \frac{\text { PV(future cash flows after initial investment) }}{\text { Initial Cost }} \ & =1+\mathrm{NPV} / \text { Initial Cost }\end{aligned}$
- Decision rule
- Accept only projects of PI > 1
- If projects are mutually exclusive, choose the one with highest PI
- Advantage
- Closely related to NPV, generally leading to identical
- Easy to understand and communicate
- Mostly useful when available investment resources are limited
- Disadvantages
- May lead to incorrect decisions in comparisons of mutually exclusive investments with different scales (similar to the IRR ranking problem).
- With multiple resource constraints, the profitability index can break down completely.
Making Capital Investment decisions
Fundamental Principles of Projected Cash Flows – Stand-alone Principle
- Just focus on relevant cash flows for a project.
- Cash flows that occur regardless of whether the project is undertaken are NOT relevant.
- The changes in firm’s current and future cash flows occur if and only if the project is accepted.
Common Pitfalls of Incremental Cash Flows
- Sunk Costs
- Sunk costs are NOT incremental cash flows
- However, it is a well established finding in psychological and behavioral research that managers find it almost impossible to ignore sunk costs, because many people have strong misgivings about “wasting” resources (loss aversion).
- Opportunity costs
- Opportunity costs ARE incremental CFs.
- No “free lunch”
- In finance, consider opportunity cost
- the value of the best alternative forgone
- Opportunity costs ARE incremental CFs.
- Working Capital
- For projects with finite life, in the last year, the investment in net working capital will be recovered.
- Side effects
- Positive side effects (synergy) – benefits to existing projects.
- If synergies exist and they often do, these benefits have to be valued and shown in the initial project analysis.
- Negative side effects (erosion) – costs to existing projects
- Positive side effects (synergy) – benefits to existing projects.
- Taxes
- a cash outflow
- all cash flows must be after-tax numbers
- Salvage Value
- Assets that are no longer needed often have some salvage (or liquidation) value if the parts are sold for scrap.
- When an asset is liquidated, we receive cash amounting to its market value (MV))
- Nevertheless, any gain on asset sale is taxed.
- Gain on Sale = MV – BV
- BV = Initial Cost – Cumulative Depreciation
- Thus, After-tax salvage value = MV - T $\times$ (MV - BV)
Value a project
计算每一年的CFFA,然后计算NPV,看是否大于0,或者计算IRR,和required return比较。
Project Analysis and Evaluation
Forecast risk
- Forecasting (Estimation) risk
- The mistake may come from wrong forecast of future cash flows.
- The mistake may come from wrong estimation of cost of capital (the discount rate).
- If our estimation are seriously in error, then discounted cash flow analysis is a classic GIGO (garbage-in, garbage-out)
Solutions to Forecast Risk
- Scenario Analysis: 概率分布
- 在不同情况下的NPV,找到最大最小值
- Sensitivity Analysis: 参数⻛险
- There are different sources of uncertainty in our project
- Discountor: interest risk
- Price/cost/expense: market risk
- Sale quantity: policy risk
- find out how NPV varies with these sources
- Useful for pointing out which variables have higher forecasting risk
- The greater the volatility in NPV in relation to a specific variable, the larger the forecasting risk associated with that variable and the more attention we want to pay to its estimation.
- There are different sources of uncertainty in our project
- Break-even Analysis
- Accounting break-even
- No accounting net loss or net gain
- NI = 0
- $Q_{ac} = (D + FC)/(P - v)$
- Financial break-even
- results a zero NPV
- $Q_{fi} = (OCF_{fi} + FC)/(P - v)$
- $OCF_{fi}>D$
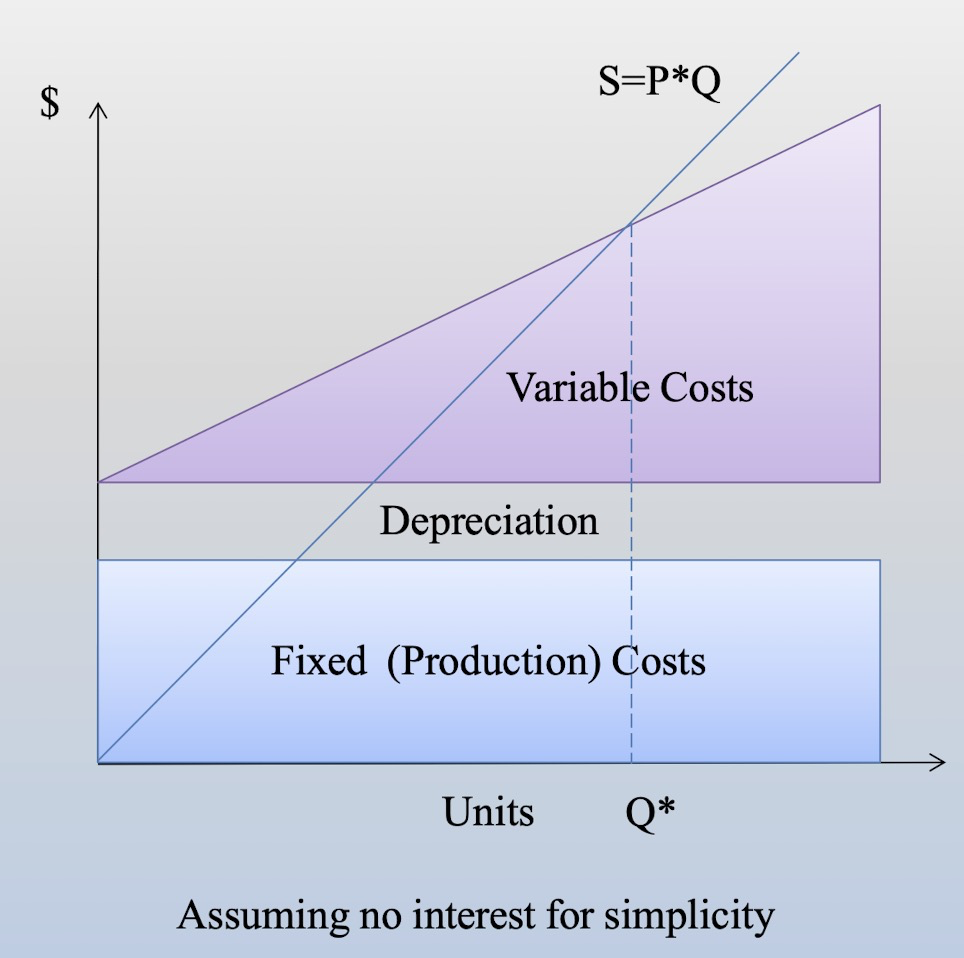
- operating leverage
- measure of operating risk
- degree of operating leverage(DOL):
- How sensitive is OCF with regard to sales change
- $DOL = (\Delta OCF/OCF)/(\Delta Q/Q)$
- relation between DOL and FC
- consider no interest and taxes
- OCF = EBIT + D = [(P-v) ×Q – FC – D] + D
- $DOL = 1 + \frac{FC}{OCF}$
- High FC causes high DOL, meaning high operating leverage(risk), leading to high forecasting risk of quantities of sales
- The higher the DOL, the more accurate the forecast of sales volume is needed
- Accounting break-even
Operating Risk and Industry
High fixed cost and low variable cost
- Entertainment industry: movie, vedio, software, gaming
Low fixed cost, high variable cost
- Industry with light assets: street stall, online teaching
The nature of the industry determines the beta (systematic risk) of the company.
- When the fixed cost is very large, it is difficult to act according to market circumstances or to switch . So the company has to be exposed to the market condition, which leaves the company a high beta or sensitivity to the macro economy.
Risk and return
Expected return
- Net return = Income yield + capital gain (loss)
- Income yield: cash payout received
- capital gain or loss: change in security price
- calculating average return from historical data
- arithmatic mean
- application: expected return
- geometric mean
- applicaton: YTM
- The geometric average will be less than the arithmetic average unless all the returns are equal.
- The estimate of arithmetic average is overly optimistic for long horizons
- The estimate of geometric average is overly pessimistic for short horizons
- arithmatic mean
- Blume’s formula gives an unbiased estimate
- Suppose we have calculate geometric and arithmetic return average from N years of data, and we wish to use these averages to form a T-year average return forecast, $R(T)$, where T is less than N:
- $$R(T)=\frac{T-1}{N-1}* \text{Geometric average}+\frac{N-T}{N-1}*\text{Arithmetic average}$$
Risk
Define risk
Uncertainty
Ambiguity
Probability of bad things (VAR)
- $\sigma^2=\sum_{i=1}^n p_i\left(R_i-E(R)\right)^2$
Probability of bad things+how bad they could be(ES)
- $\sigma = \sqrt{\sigma^2}$
Variance and Standard Deviation Estimations Using Historical Data Variance:
- $$\operatorname{Var}(R)=\sigma^2=\frac{\sum_{t=1}^T\left[\left(R_t-\bar{R}\right)^2\right]}{T-1}$$
- where $\bar{R}=\frac{\sum_{t=1}^T R_t}{T}$
- Standard deviation $=\sqrt{\operatorname{Var}(R)}=\sigma$
Portfolios
- A portfolio is a collection of assets or securities:
- Financial assets
- Bonds, Stocks, bank deposits etc.
- Non-Financial Assets
- Real estate, Fixed Assets, Human Capital etc.
- Financial assets
- The return and risk for a portfolio is measured by the portfolio’s expected return and standard deviation, just as with individual assets.
- Portfolio weight can be negative, which is “short sell”
Portfolio Expected Returns and Portfolio Variance
$$E\left(R_P\right) =\sum_{j=1}^m w_j E\left(R_j\right) $$$$\operatorname{var}\left(R_P\right) =\sum_{i=1}^m w_i^2 \operatorname{Var}\left(R_i\right)+\sum_{i=1}^m \sum_{j=1}^m w_i w_j \operatorname{Cov}\left(R_i, R_j\right)$$$$\sum_{j=1}^m w_j =1$$
return and risks of portfolios
- Fully diversifed portfolios are all on the same straight line(average return / standard deviation)
- The benefit of aggregation
- The difference between large firms and small firms
- small firms have higher risk, thus higher return
- To what extent the risk can be diversified to
- systematic risk cannot be eliminated
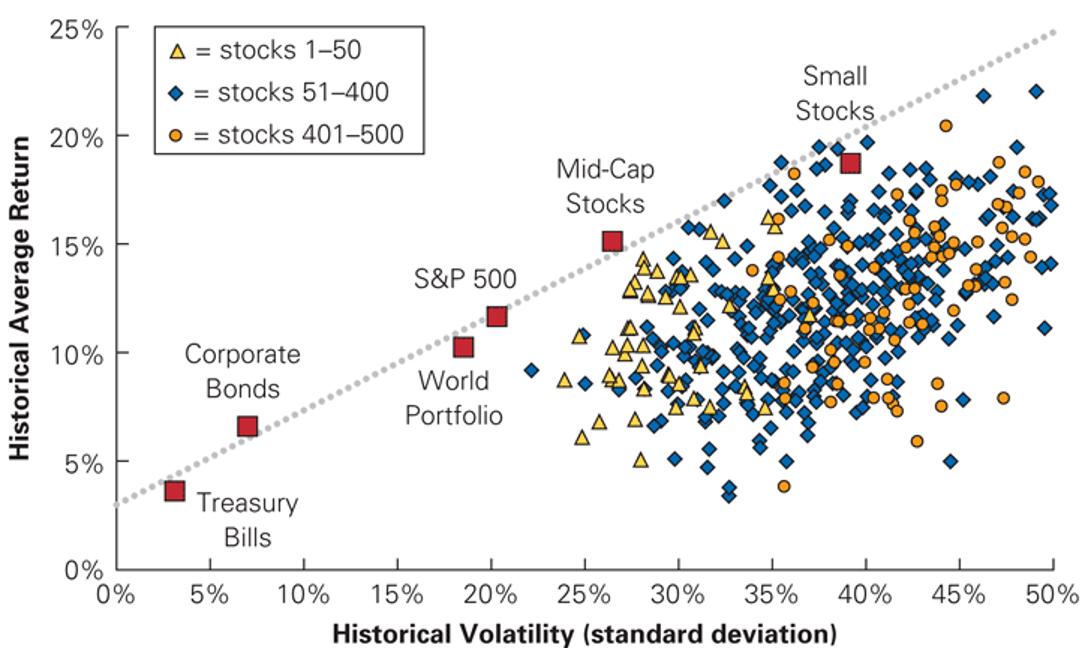
- differentiate firm-specific risk and systematic risk
types of risk in stock portfolios
- Firm Specific News (good or bad news about an individual company)
- Example
- Losing money due to poor management
- Warehouse caught a fire
- Diversifiable risk
- Can be eliminated by holding other stocks with opposite risk exposure
- Example
- Market-Wide News (news that affects all stocks) (Systematic risk)
- Example
- Recession
- Raise interest rate
- High inflation
- Non-Diversifiable risk
- Market risk affects all firms
- However, market risk is unpredictable and cannot be hedged and insured—–have to face it!
- Example
- The risk premium for diversifiable risk is zero. Investors are only compensated for bearing systematic risk.
- The expected return on a risky asset depends only on that asset systematic risk
- since unsystematic risk can be diversified away.
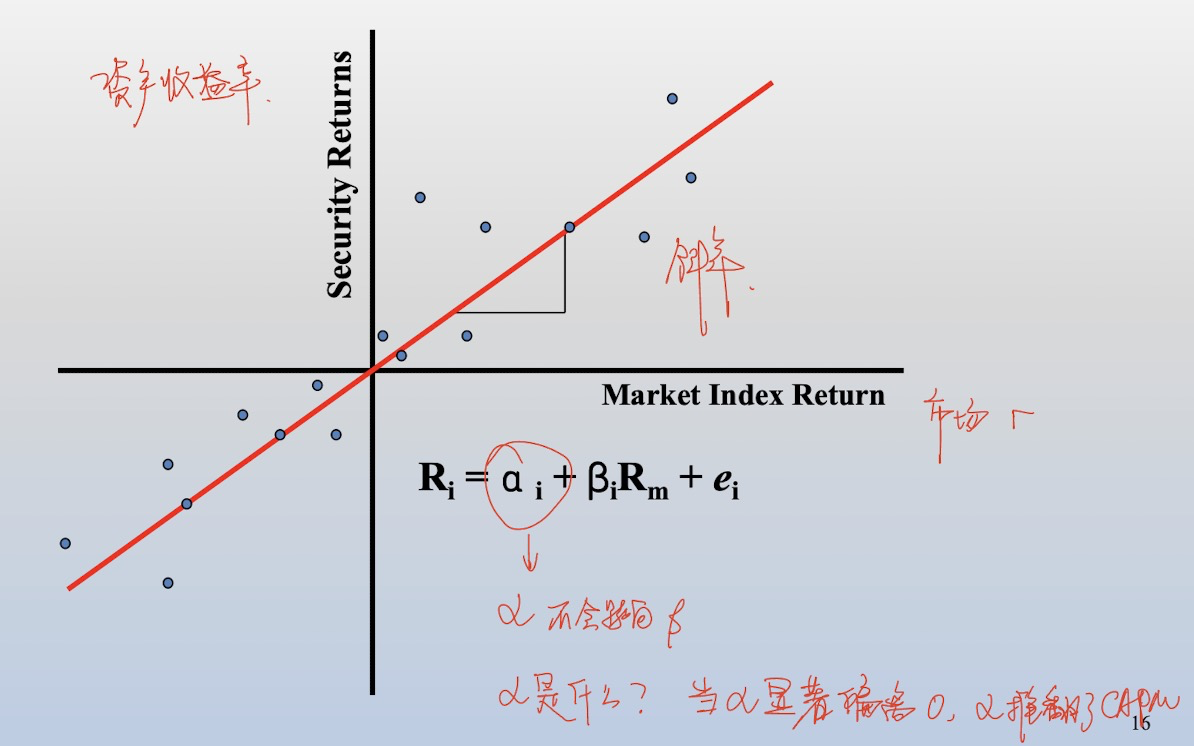
systematic risk
$$\beta_i = \frac{Cov(r_i,r_m)}{Var(r_m)}$$
- A beta of 1 implies the asset has the same systematic risk as the overall market.
- A beta < 1 implies the asset has less systematic risk than the overall market.
- A beta > 1 implies the asset has more systematic risk than the overall market.
- Negative beta:
- procycle industry
- countercycle industry
Portfolio beta:
$$\beta_{portfolio} = \sum_{i=1}^n w_i\beta_i$$
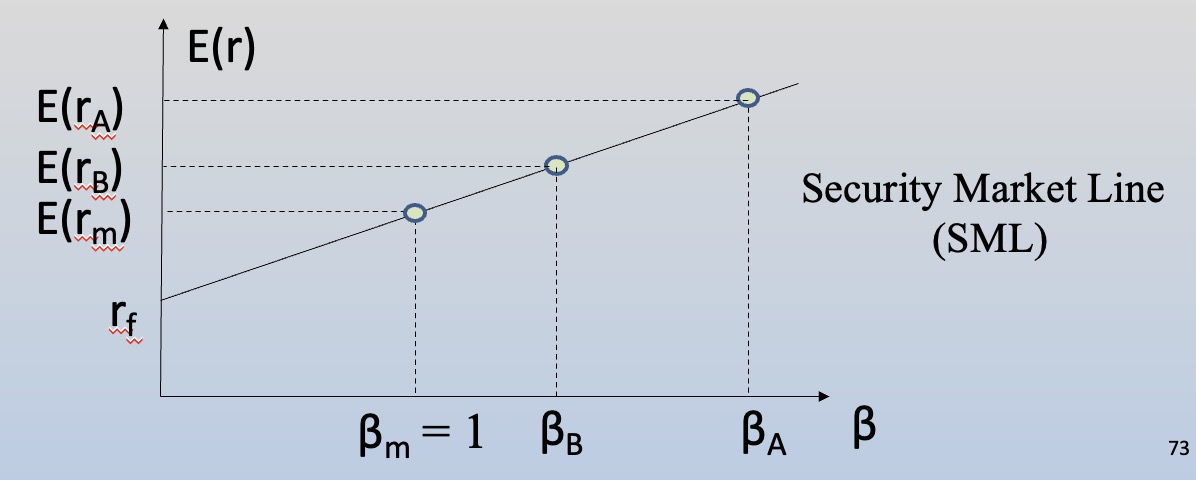
relation between beta and risk premium
reward-to-risk ratio:
$$\frac{E(R_A)-R_f}{\beta_A}$$
the fundamental result
$$\frac{E(R_A)-R_f}{\beta_A} = \frac{E(R_M)-R_f}{\beta_M}$$
therefore,
$$E(R_A)=R_f+\beta_A*[E(R_M)-R_f]$$
this is CAPM
SML, security market line
Cost of Capital 融资成本
cost of equity
- Approach 1: the SML (CAPM)
- $E(R_i)=R_f+\beta_i*[E(R_M)-R_f]$
- 有效市场均衡
- 公平定价
- Determine risk-free rate
- We recommend a rate matching the investment horizon.
- Or long-term rates, which are are less volatile than short-term rates.
- Current Wall street practice: use the 10 or 20-yr T- bond rate.
- In China, we usually use 10-year China government bond rate (or 10-year bond issued by the China Development Bank).
- Determine market risk premium
- Use the historical returns of several popular market indices to capture the market portfolio’s expected return
- The S&P 500 is the standard portfolio used to represent the performance of the U.S. stock market.
- In China, it is popular to use the CSI 300 as the market portfolio.
- Use the historical returns of several popular market indices to capture the market portfolio’s expected return
- Estimatinng Beta
- for public company, run regression
- for private company
- find comparable companies
- same industry
- find the underlying asset beta (see below), and average them
- use average beta as the estimate of private companies’ asset beta, and re-lever it.
- find comparable companies
- for public company, run regression
- Approach 2: DDM (dividend discount model)
- $P_0 = D_1/(E(R_E)-g)$
- thus
- $E(R_E)=D_1/P_0+g$
equity beta vs asset beta
- When the betas are estimated from returns on stock. They are the firm’s equity beta $\beta_E$
- The beta of the assets of the firm (asset beta $\beta_A$ ) is the beta of the common stock had the firm been financed only with equity.
$\beta_{\text {portfolio }}=\beta_A=\beta_{\text {Equity }} \frac{S}{S+B}+\beta_{\text {Debt }} \frac{B}{S+B}$
- 公司的资本结构和公司的beta决定了 $\beta_E$
- beta of asset可以看成是外生的,通常由行业决定
- 当beta of debt = 0
- 即能够正常偿还债务
- $\beta_A=\beta_{\text {Equity }} \frac{S}{S+B}$
- $\beta_{Equity}=\beta_A(1+ \frac{B}{S})$
- 推出:
- $\beta_A \le \beta_{Equity}$
determinants of $\beta_A$
- industrial feature
- high-tech, retailers, automotive firms fluctuate with the business cycle.
- utilities, railroads, food are less dependent upon cycle.
- Operating leverage
Cost of Debt and preferred stock
cost of debt
The cost of capital that a firm must pay on its debt.
- Before tax: $R_D$
- After tax: $R_D(1-T_c)$
- 利息可以避税
- 1 - tax rate
Method 1: YTM
- from the perspective of borrowers
- Ex-ante: Before/ When the bond is issued
- compute effective annual return from price
- Ex-post: After the bond is issued
- Consider a one-year bond with an ex-ante YTM of y.
- For each 1 dollar invested in the bond today, the bond promised to pay(1+y)dollar in one year.
- Suppose, however, it is anticipated that the bond will default with probability p, in which case bond holders will receive(1+y–L)dollar, where L represents the expected loss per $1 of debt in the event of default.
- Then the expect return of the bond is
- $r_d=[p(1+y-L)+(1-p)(1+y)]/1-1=y-pL$
- $r_d = YTM - Prob(\text{default}) \times \text{Expected Loss rate}$
- YTM reflects default risk and liquidity risk
Method 2: CAPM
- From the perspective of bond holders when debt are held as equities. Or when bonds are sold before maturity.
- $r_d = \text{risk-free rate} + \beta × \text{market risk premium}$
- Since bank loans and many corporate bonds are traded infrequently if at all, it is difficult to estimate the betas of individual debt securities.
- Alternatively, we can approximate beta using estimates of betas of bond indices by rating category
- $R_D$ from CAPM reflects mostly market risk/interest risk. In another word, $R_D$ is highly correlated to Duration.
- 主要反应市场风险
- For multiple bonds with different maturities, the average cost of debt is then the weighted average cost.
Preferred Stock (优先股)
Hybrid of common stock and bond
- Senior to common stock, but subordinate to bonds, upon liquidation
- Priority over common stock in payment of dividend
Dividends
- Normally with a fixed dividend rate of stated value
- Dividends can be deferred indefinitely
- Most dividends are cumulative: If preferred dividends are not paid in a particular year, they will be carried forward as an arrearage.
Generally do not carry voting rights
Preferred stock can be considered as a perpetuity
- (generally) have a constant dividend every period
- (expected)to pay dividends forever
Cost of preferred stock:
- $R_p=D/P_0$
- where D is the fixed dividend, $P_0$ is the current price per share
Weighted average cost of Capital (wacc)
- When discounting CFFA we need the required return for the entire firm
- Find the “average” cost of all types of capital
- The weights are determined by how much of each type of financing that we use.
- Note, both costs and weights are market-based.
Tax
- Concerned with after-tax cash flows, so consider the effect of taxes on the various costs of capital. Interest expense reduces our tax liability
- This reduction in taxes reduces our cost of debt
- After-tax cost of debt = $R_D(1-T_c)$
- Dividends are not tax deductible, so there is no tax impact on the cost of equity
- 只有债有税后成本,只有Debt有税盾作用
Capital Structure Weights
- Notation
- E(S)= market value of equity = outstanding shares * price per share
- D(B)= market value of debt = outstanding bonds * bond price
- V = market value of the firm = D + E
- Weights
- $w_E = E/V$
- $w_D = D/V$
- $\color{red}{\text{WACC} = w_E \times R_E + w_D \times R_D(1-T_C) + w_P \times R_P}$
- $R_E$ is cost of equity, $R_D(1-T_C)$ is after-tax cost of debt, $R_P$ is cost of preferred stock
- 当只有股权时, $\text{WACC}=R_A=R_E=R_U$
- $R_A$ is cost of asset, $R_U$ is unlevered
Floatation Cost
$$f_A=S/V\times f_S+B/V\times f_B$$
Financial Leverage and Capital Structure Policy
- Goal of a corporation:
- Creating value through capital structure choices—-minimizing WACC
Capital structure in a perfect market
Perfect Capital Markets
- Investors and firms can trade the same set of securities at competitive market prices equal to the present value of their future cash flows.(市场有效)
- There are no taxes, transaction costs, or issuance costs associated with security trading. (市场⽆摩擦)
- A firm’s financing decisions do not change the cash flows generated by its investments, nor do they reveal new information about them.(融资决策不改变未来EBIT)
Results
$\color{red}{\text{leverage ratio} = E/V}$
- 加杠杆,举债
In this market, the firm is neither helping nor hurting its stockholders by restructuring. In other words, an investor is not receiving anything from corporate leverage that she could not receive on her own.
change in structure
- doesn’t effect cash flow
- effect cost of equity
- doesn’t effect wacc
- doesn’t effect value of the firm
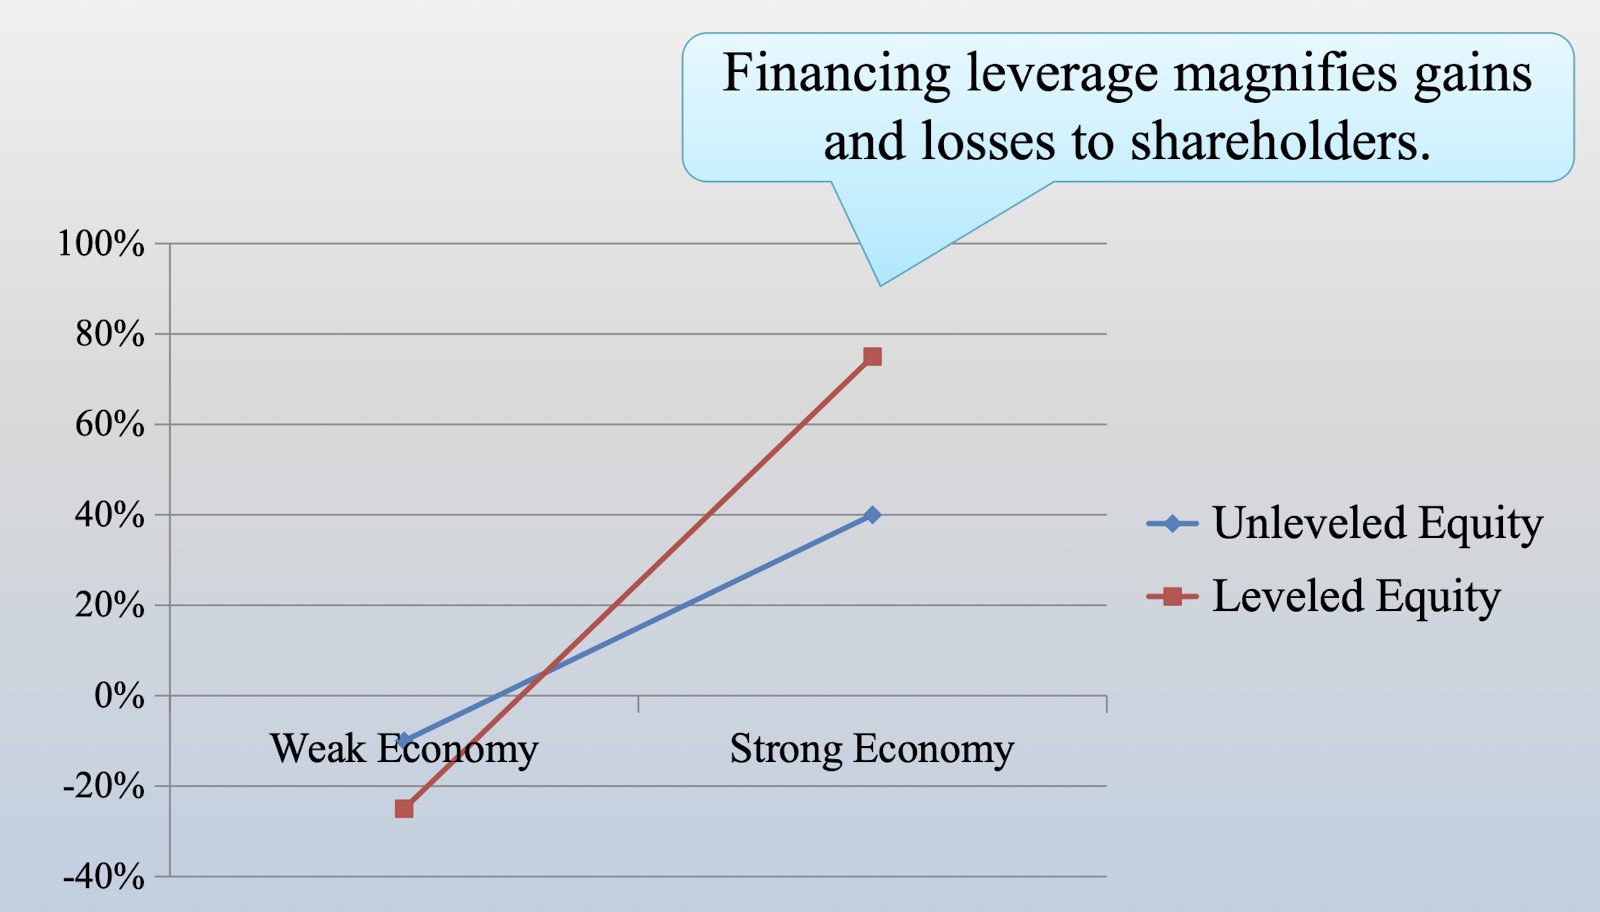
投资者可以手动上杠杆(举债等),手动调整风险-回报率
- the entrepreneur’s choice of capital structure does not affect the opportunities available to investors.
- Investors can alter the leverage choice of the firm to suit their personal tastes either by borrowing and adding more leverage or holding bonds and reducing leverage.
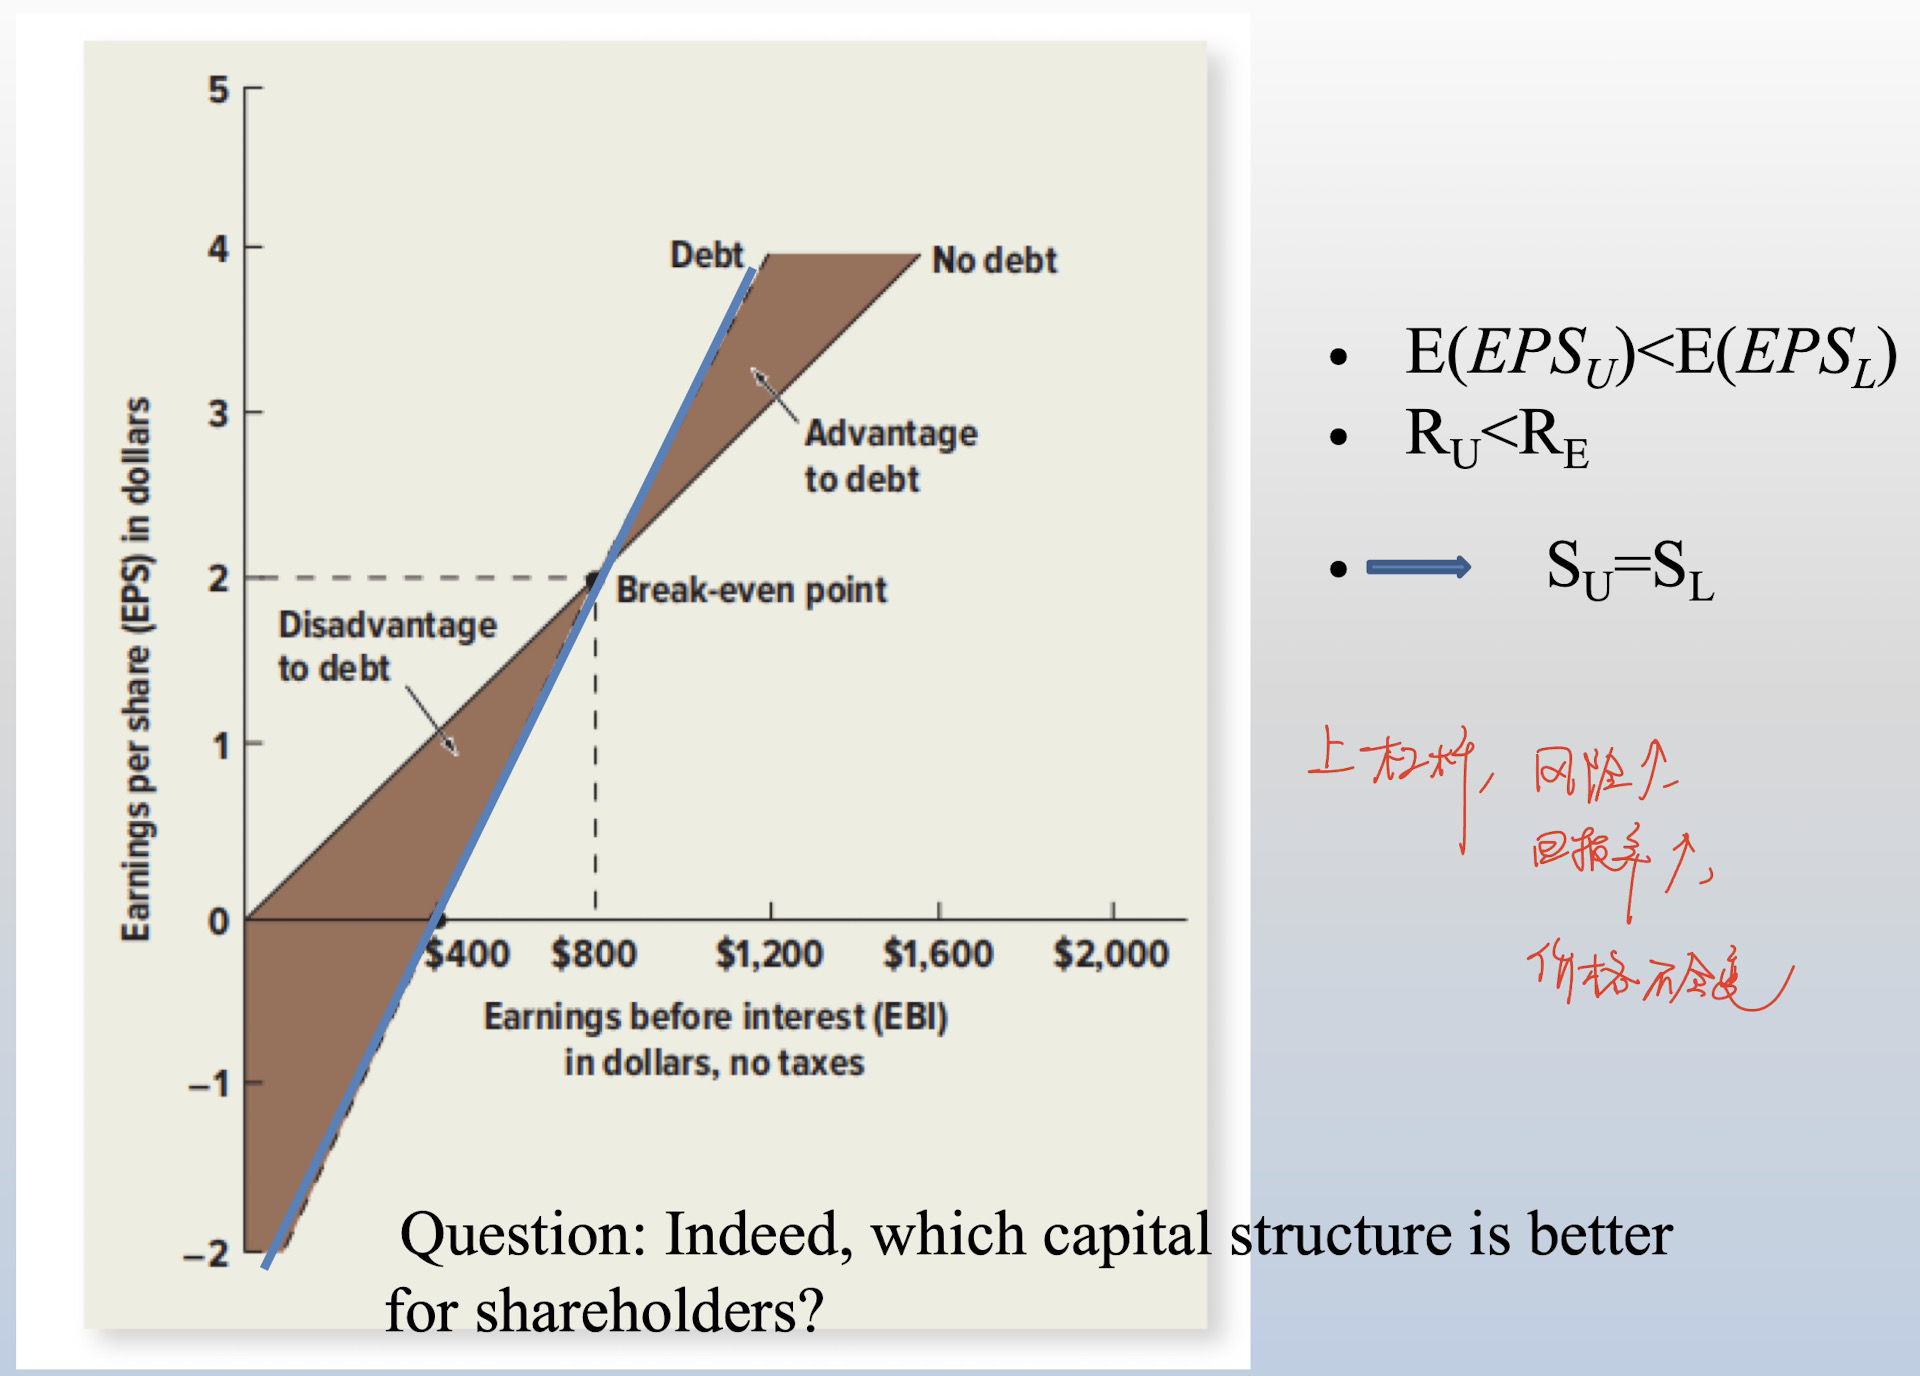
- EPS会变化!
MM Proposition with no taxes
- Proposition 1
- In perfect capital markets, the total value of a firm is equal to the market value of the total cash flows generated by its assets and is NOT affected by its choice of capital structure.
- $V_L = V_U$
- $\text{WACC}=R_U=R_A=\frac{E}{V}\times R_E+\frac{D}{V} \times R_D$
- 把钱从左口袋放进右口袋,不会变的更富有
- Proposition 2
- the effect of leverage on the expected returns of a firm’s securities can be expressed:
- $R_E=R_U+\frac{D}{E}\times (R_U-R_D)$
- 只改变cost of equity
- the effect of leverage on the expected returns of a firm’s securities can be expressed:
- Corollary of Proposition 2
- The effect of leverage on a firm’s equity can also be expressed in terms of beta(without considering tax):
- $\beta_E=\beta_U+\frac{D}{E}\times (\beta_U-\beta_D)$
- $\beta_U$ 可以看成是industry的,也可以写作 $\beta_A$
MM: Beyond the Propositions
- Conservation of Value Principle(价值守衡原理)for Financial Markets
- With perfect capital markets, financial transactions neither add nor destroy value, but instead represent a repackaging of risk (beta and therefore return).
- Any financial transaction that appears to add value may be exploiting some type of market imperfection.
Capital structure with Taxes
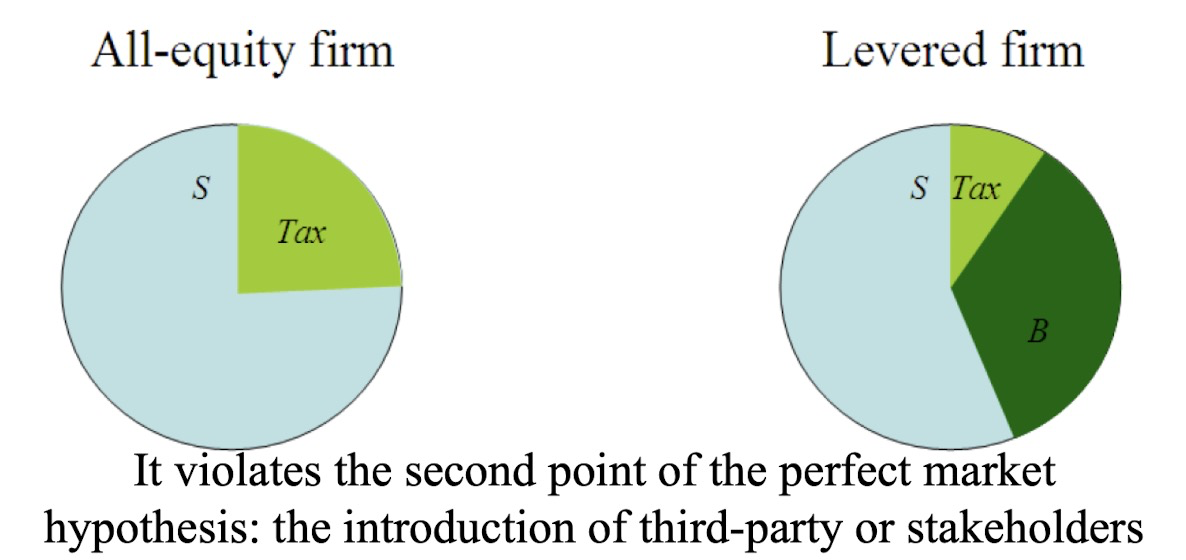
The levered firm pay less in taxes than those in all equity firm because interest on debt is tax-deductable
- Corporations pay taxes on their profits after interest payments are deducted. Thus, interest expense reduces the amount of corporate taxes.
Thus, sum of debt and equity in levered firm is greater than equity in all-equity firm
- This creates an incentive to use debt.
The reduction in taxes due to interest is called interest tax shield.
- Interest Tax Shield = Corporate Tax Rate × Interest Payments, 当期税盾
The Interest Tax Shield with Permanent Riskless Debt
- The tax shield can be valued as a perpetuity
- $PV(\text{Interest Tax Shield}) = T_C \times D$
- D 是当下debt的MV
Optimal Capital Structure with Taxes
- Higher interest payment reduces tax payments. It leaves more cash flows to investors, and thus enhances firm value.
- However, a firm need not use 100% debt financing. A firm receives a tax benefit only if it have taxable earnings in the first place.
- The optimal level of leverage from a tax saving perspective is the level such that interest equals EBIT
- 在interest能抵消EBIT后,继续举债就没用了
MM Proposition with Taxes
- Proposition 1
- The total value of the levered firm exceeds the value of the firm without leverage due to the present value of the tax savings from debt.
- $V^L=V^U+PV(\text{interest tax shield})$
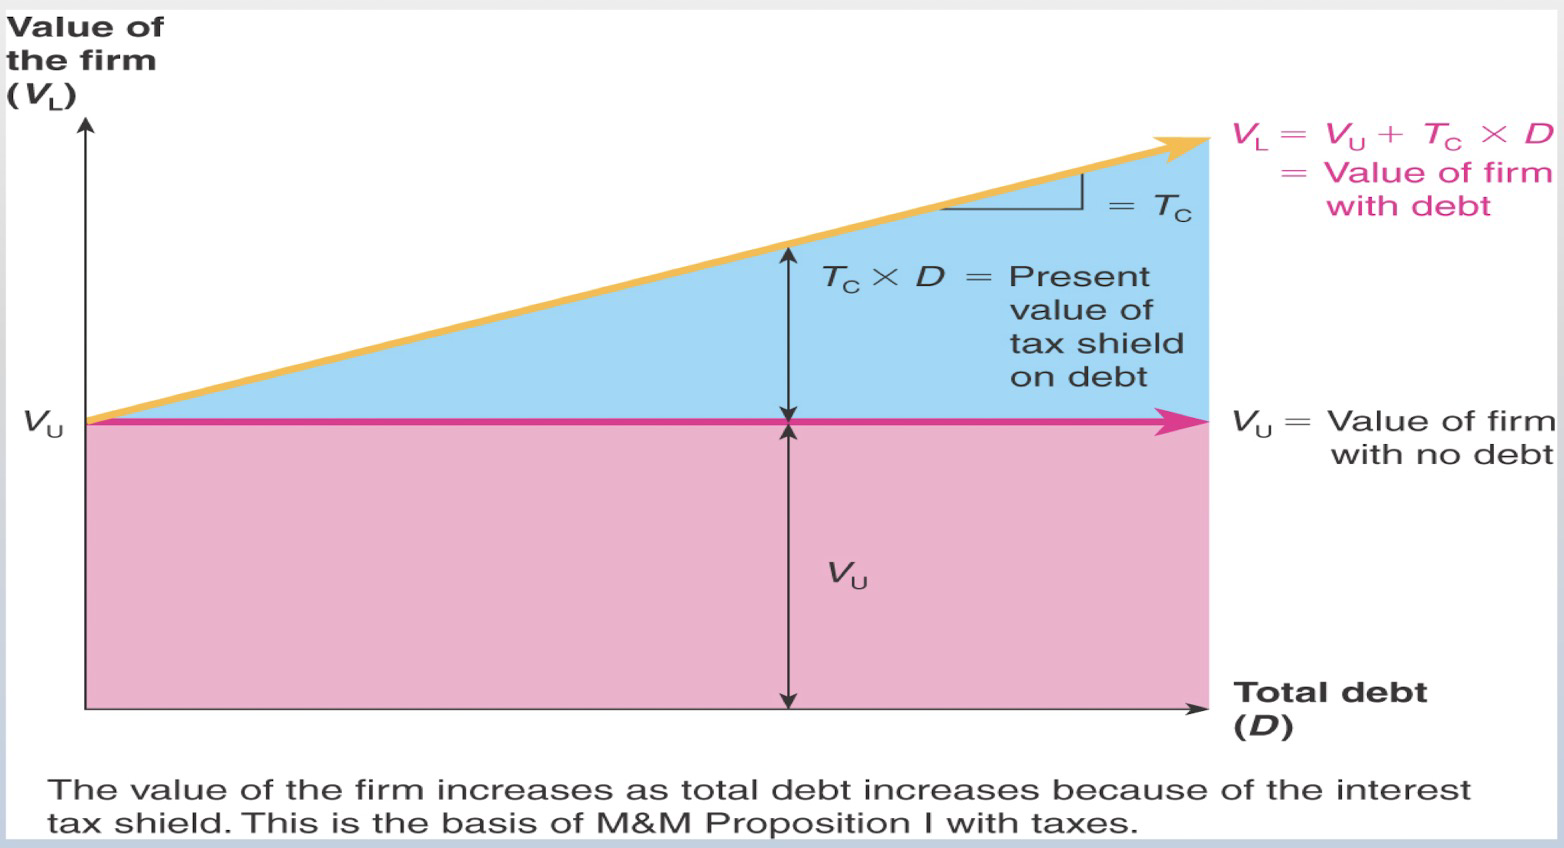
- $$\color{red}{V^U=\frac{OCF}{R_U}=\frac{EBIT(1-T_C)}{R_U}}$$
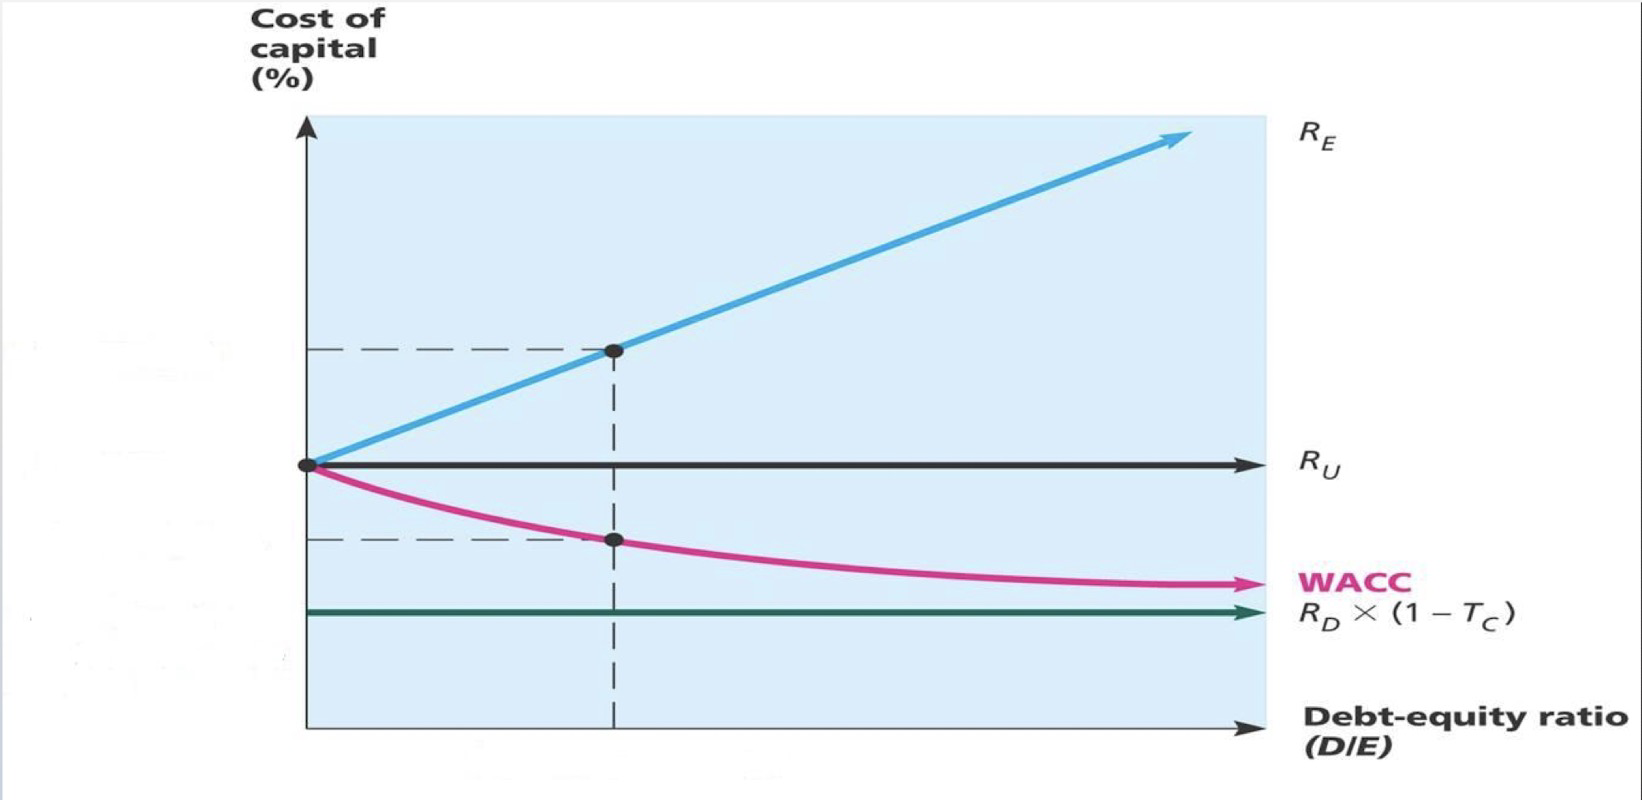
- Proposition 2
- $$WACC=\frac{E}{E+D}R_E+\frac{D}{E+D}R_D(1-T_C)$$
- $$R_E=R_U+\frac{D}{E}(R_U-R_D)(1-T_C)$$
- $$WACC=R_U(1-T_C\frac{D}{V_L})$$
- In the case of corporate tax, adding leverage decrease WACC in the denominator, which lead to an increase of firm value overall.
- Corollary of MM Proposition 2 with Tax
- $$\beta_E=\beta_U+\frac{D}{E}\times (\beta_U-\beta_D) \times (1-T_C)$$
- $\beta_A=\beta_U$
From Unlevered to Levered
| no tax | with tax | |
|---|---|---|
| Firm Value | No | Increase |
| WACC | No | Decrease |
| $R_E$ | Increase | Increase |
| S(with repurchase) | No | Increase |
Capital structure with Financial Distress and Bankruptcy costs
Default
- A firms that fails to make the required interest or principal payments on its debt, or violates a debt covenant, is in default.
- After the firm defaults, debt holders are given certain rights to the assets of the firm
- Debt holders may even take legal ownership of the firm’s assets through bankruptcy.
Bankruptcy
Equity financing does not carry the risk of bankruptcy as the firm is not legally obligated to pay dividends.
In case of no bankruptcy cost, the risk of bankruptcy is not a disadvantage of debt
- Rather the bankruptcy shifts the ownership of the firm from equityholders to bondholders.
- That is because the total value available to all investors does not change
- Rather the bankruptcy shifts the ownership of the firm from equityholders to bondholders.
In reality, the bankruptcy process is complex, time-consuming, and costly.
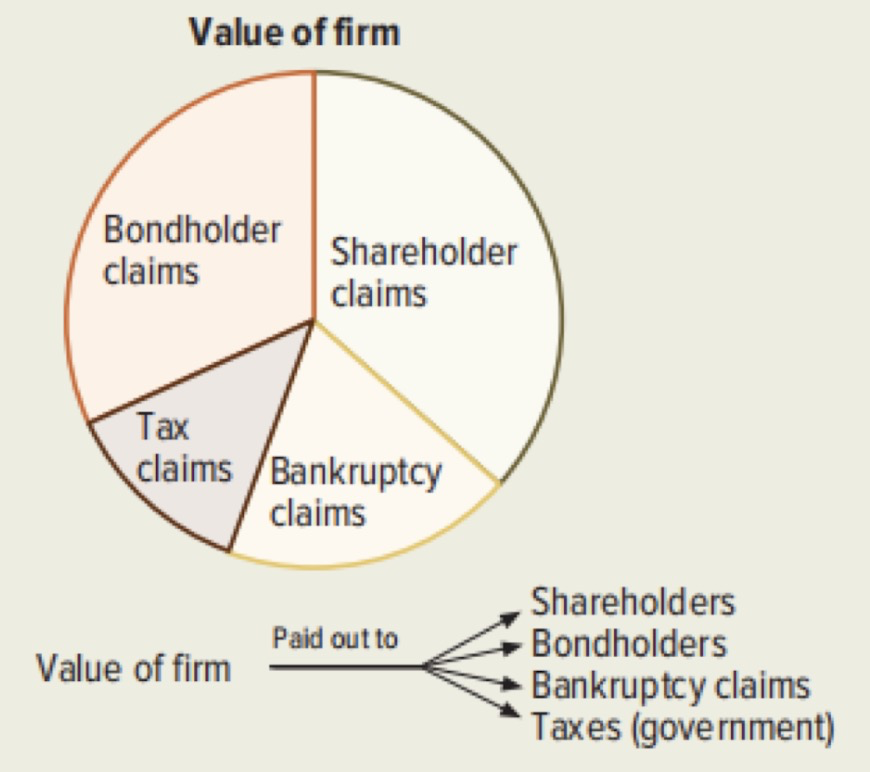
$$V_L=V_U+PV(\text{interest tax shield})-PV(\text{cost of bankruptcy})$$
- it violates the second perfect market hypothesis
Bankruptcy costs will offset the tax benefit from the use of the debt.
- Direct bankruptcy costs: the costs that are directly associated with bankruptcy and administrative expenses.
- types
- legal and administrative costs
- time costs
- advisory fees
- Overall, typically 2 – 3% of assets for large corporations, can be as high as 20% for smaller one
- minimize
- proper coordination between bondholders and stockholders.
- Negotiating costs are minimized if only one lender can shoulder the entire debt.
- Bondholders can purchase stock, so that two parties become non-separable entities.
- types
- Indirect bankruptcy costs: the costs come from financial distress
- A firm is financially distressed(财务困境) when it has difficulty meeting its debt obligations. To relieve the financial distress, a firm may sell assets, cut investments, etc.
- Costs arising because people perceive you to be in financial trouble
- Fire sales of assets
- Loss of customers
- Loss of suppliers
- Loss of valuable employees
- It is estimated that the potential loss due to financial distress is 10% to 20% of firm value
- For unlevered firm, there is no financial distress costs
- the third condition of perfect market conditions is broken.
- $$V_L=V_U+PV(\text{interest tax shield})-PV(\text{cost of bankruptcy and financial distress})$$
- Direct bankruptcy costs: the costs that are directly associated with bankruptcy and administrative expenses.
Agency Problems
- Agency risk
- Interest splits between Debt holders and Equity holders
- Agency costs also will offset the tax benefit from the use of the debt
- Since shareholders only have limited liability, when a firm faces financial distress, they have the incentive to take risky projects even if those are negative-NPV projects.
- Effectively, the equityholders are gambling with the debt holders’ money.
- When a firm faces financial distress, shareholders have an incentive to withdraw money from the firm, if possible.
- the firm may sell assets (or borrow money)below market value and use the funds to pay an immediate cash dividend to the shareholders
- For unleveled firms, maximizing equityholders’ value is equivalent to maximizing firm’s value
- For levered firms, managers maximize equityholders’ value. Thus when the firm faces financial distress, interests split between stakeholders and managers’ strategy may destroy firm’s value as a whole.
- Undertake risky projects with negative NPV
- Forgo riskless projects with positive NPV
- Cashing out
- Minimize
- Require the firm to satisfy restrictions on various accounting ratios, such as the debt-equity ratio, interest coverage, and working capital.
- Restrict the firm to do certain things, such as sell assets, issue of additional debt, pay dividends, engage in merger activity, etc.
- Pricing grids. For example, interest rate changes with borrowers’ credit quality
- Firms that violate these covenants are in technical default, which means that debtholders can demand repayment even if the firm has not missed an interest payment.
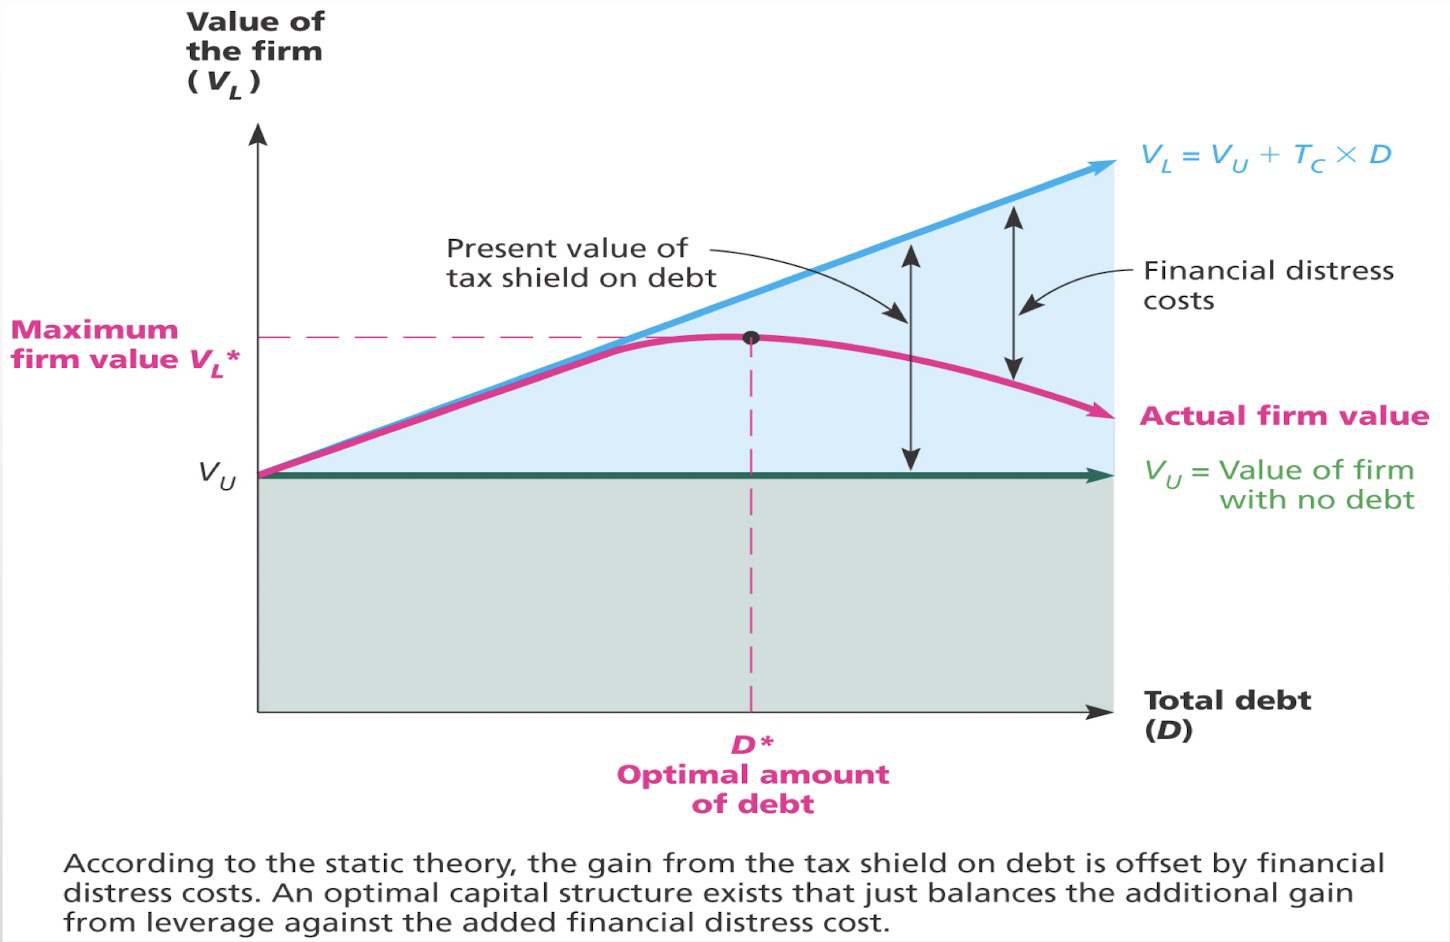
Optimal Leverage
The trade-off theory
- The firm picks its capital structure by trading off the benefits of the tax shield from debt against the costs of financial distress.
- At the optimal leverage ratio, the tax savings that result from increasing leverage are perfectly offset by the increased probability of incurring the costs of financial distress.
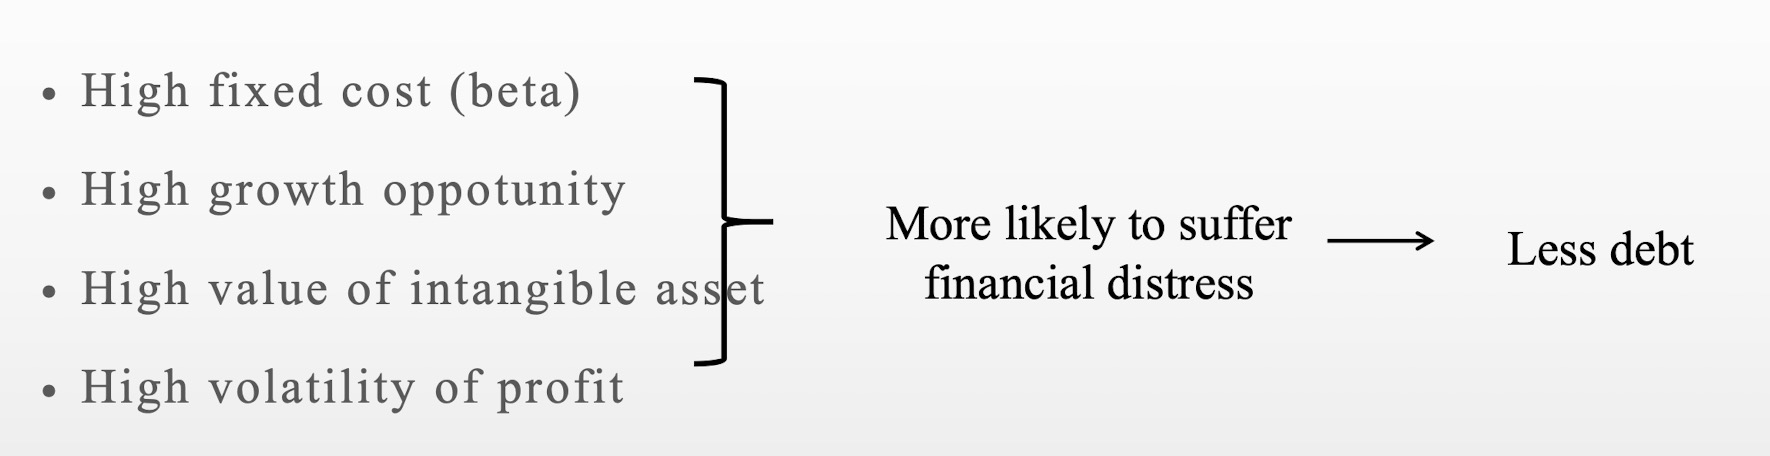
R&D-Intensive Firms
- Firms with high R&D costs (high beta) and high future growth opportunities typically maintain low debt levels.
- These firms tend to have low current free cash flows, low liquidity, and high probability to suffer from financial distress.
Low-growth, mature firms
- Mature, low-growth firms with stable cash flows and tangible assets often carry a high-debt load.
- These firms tend to have high free cash flows, few good investment opportunities, and less likely to be in financial distress.
Managerial Recommendations
- Firms with mostly tangible assets that can be sold without great loss in value have lower risk of financial distress. Firms rely heavily on intangibles, debt will be less attractive.
- Firms with low volatility of profit have less risk of experiencing financial distress compared to firms with high volatility of profit.
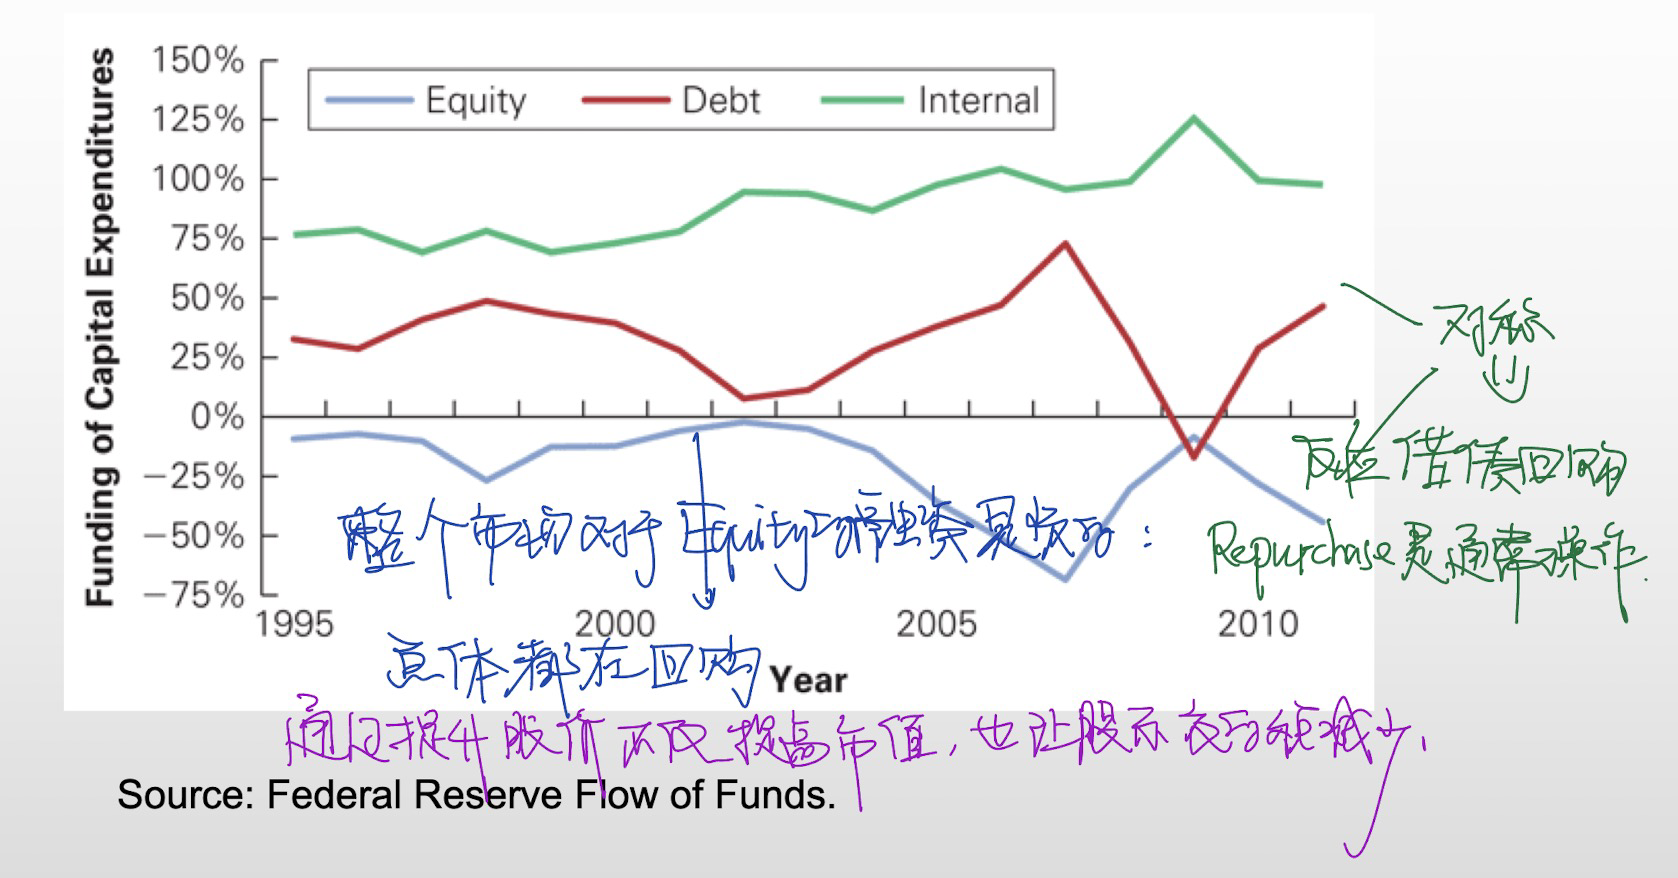
股权融资(新发股)会导致股价下降,导致增加融资成本,进而鼓励借贷。
人们认为当股价overpriced时候会issue stock
- The stock price declines on the announcement of an equity issue
- Asymmetric information discourages issuing equities
现实中,资本结构主要还是取决于价格,哪个便宜选哪个。通常的顺序是retained earning > debt > stock
但中国发债太贵,优先发股
Appendix
Valuation for the leverage firm
- Method 1: Adjusted Present Value Approach
- $V_L=V_U+T_CD$ = Net present value of unlevered firm+Tax shield
- From another perspective:
- OCF = EBIT - Tax + Depreciation
- = $EBIT(1-T_C)+Depreciation+Interest*T_C$
- = Unlevered cash flow + $Interest*T_C$
- Assumming no change of NWC and NCS, then
- $$V_L=PV(CFFA)=PV(OCF)=V_U+T_CD$$
- Method 2: Flow to equity approach
- $$V_L=E+D=\frac{\text{cash flow from proj. to shareholders}}{E}+D=\frac{\text{EBIT-Interest-Tax+Depreciation}}{E}+D$$
- Method 3: wacc approach
- $$V_L=\frac{\text{Unlevered cash flow}}{WACC}=\frac{EBIT(1-T_C)+Depreciation}{WACC}$$
记
20230319-20230320复习笔记。